This Social Media Marketing Dubai case study compares September 2026, before I took over the account, with October 2026, the first month under my management for social media and paid advertising. It uses the client’s reporting data across sales, customer activity, Instagram, TikTok, Facebook and available paid-media spend.
The goal of this case study is not to claim that one marketing action alone caused every business result. It is to show what changed during the first month of the new marketing management period and how I evaluate social-media growth together with commercial outcomes.
Social Media Marketing Dubai Results: September vs October 2026
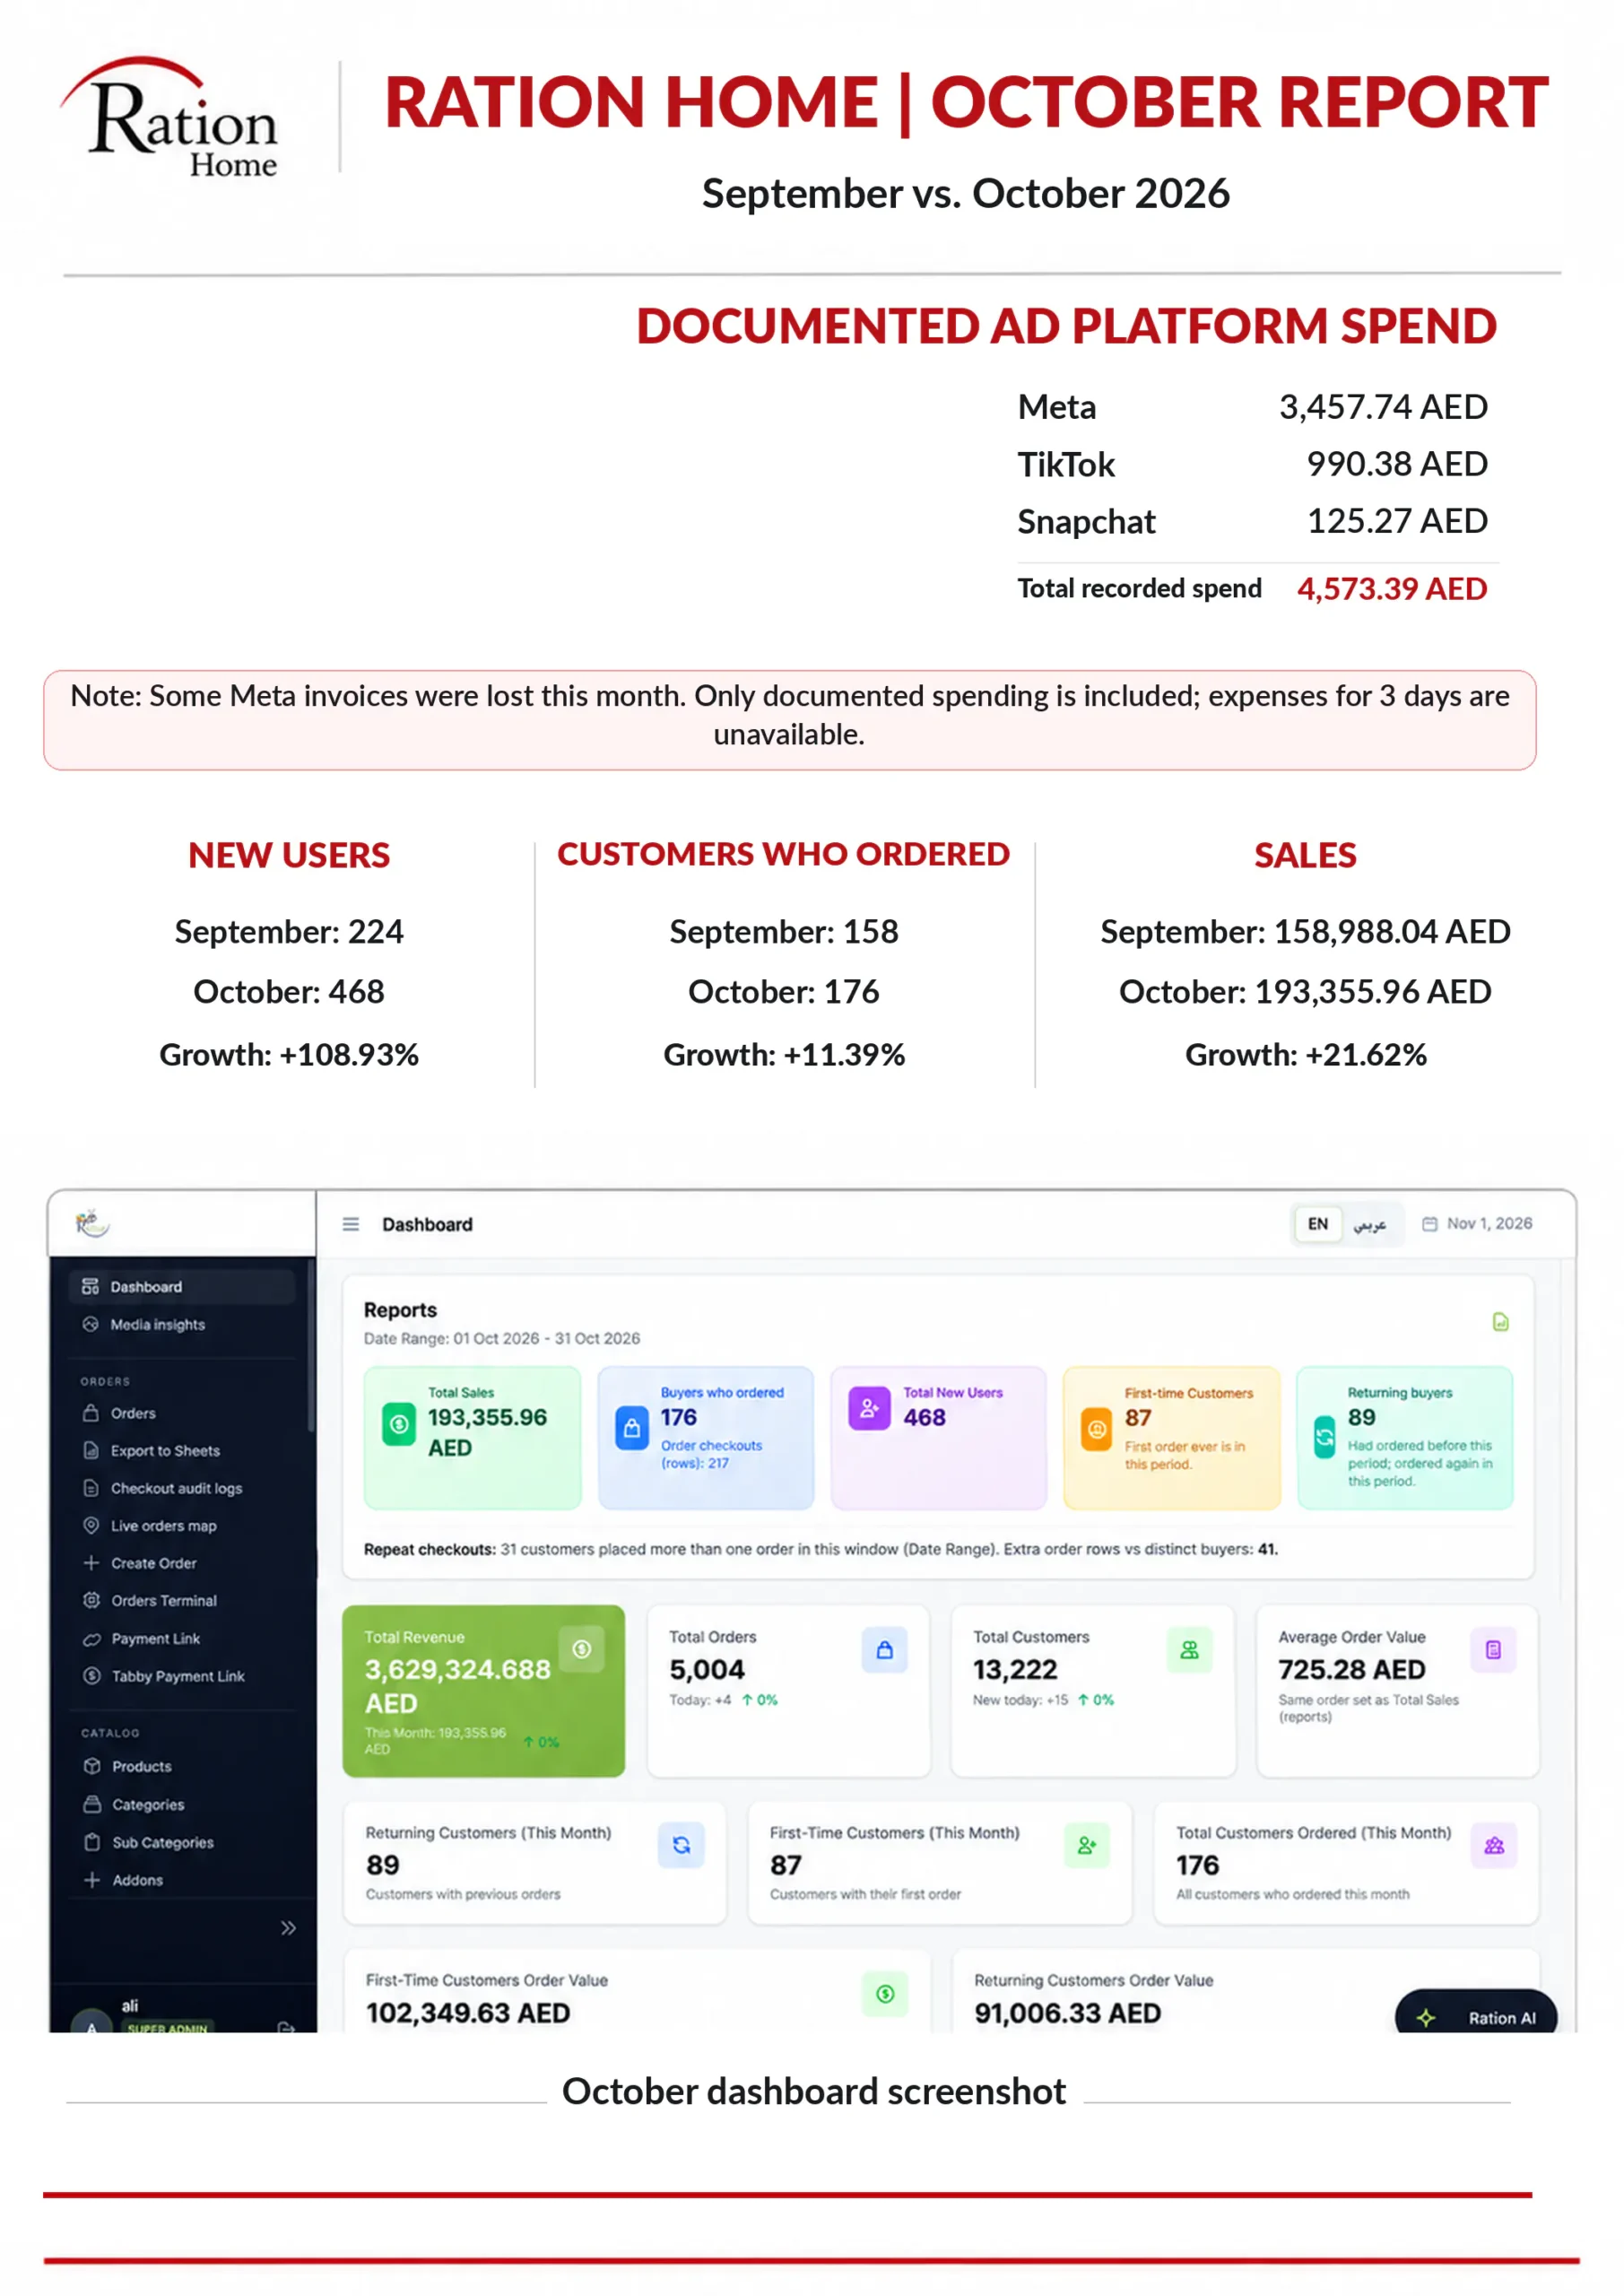
Report evidence: the overview dashboard compares the business baseline before takeover with the first month under management. It documents October paid-media spend alongside reported sales, ordering customers and new users, making it the clearest business-level snapshot in this case study.
- Sales: AED 158,988.04 in September → AED 193,355.96 in October, approximately +21.62%.
- Customers who ordered: 158 → 176, approximately +11.39%.
- New users: 224 → 468, approximately +108.93%.
- Instagram reach: 13.5K → 108.8K, approximately +705.9%.
- Instagram views: 57.5K → 253.9K, approximately +341.6%.
- Instagram link clicks: 326 → 1.5K, approximately +360.1%.
- Instagram follows: 77 → 433, approximately +462.3%.
- TikTok video views: 129 → 163.7K.
Paid Media Spend in October
The available October advertising spend recorded in the report was:
- Meta: AED 3,457.74
- TikTok: AED 990.38
- Snapchat: AED 125.27
- Total available spend: AED 4,573.39
Important reporting note: some Meta invoices were unavailable during the month, and three days of spend were not available in the report. The AED 4,573.39 figure therefore represents the documented spend available for reporting, not necessarily the complete month’s media cost.
Business Performance: Sales and Customer Activity
The commercial dashboard shows that October ended with AED 193,355.96 in sales, compared with AED 158,988.04 in September. That is an increase of approximately 21.62% during the first month of the new management period.
Customers who placed orders increased from 158 to 176, while new users increased from 224 to 468. The new-user increase is particularly important because social media management should not be evaluated only by likes and views; it should also be assessed against audience acquisition and downstream business activity.
Instagram: The Strongest Month-over-Month Growth
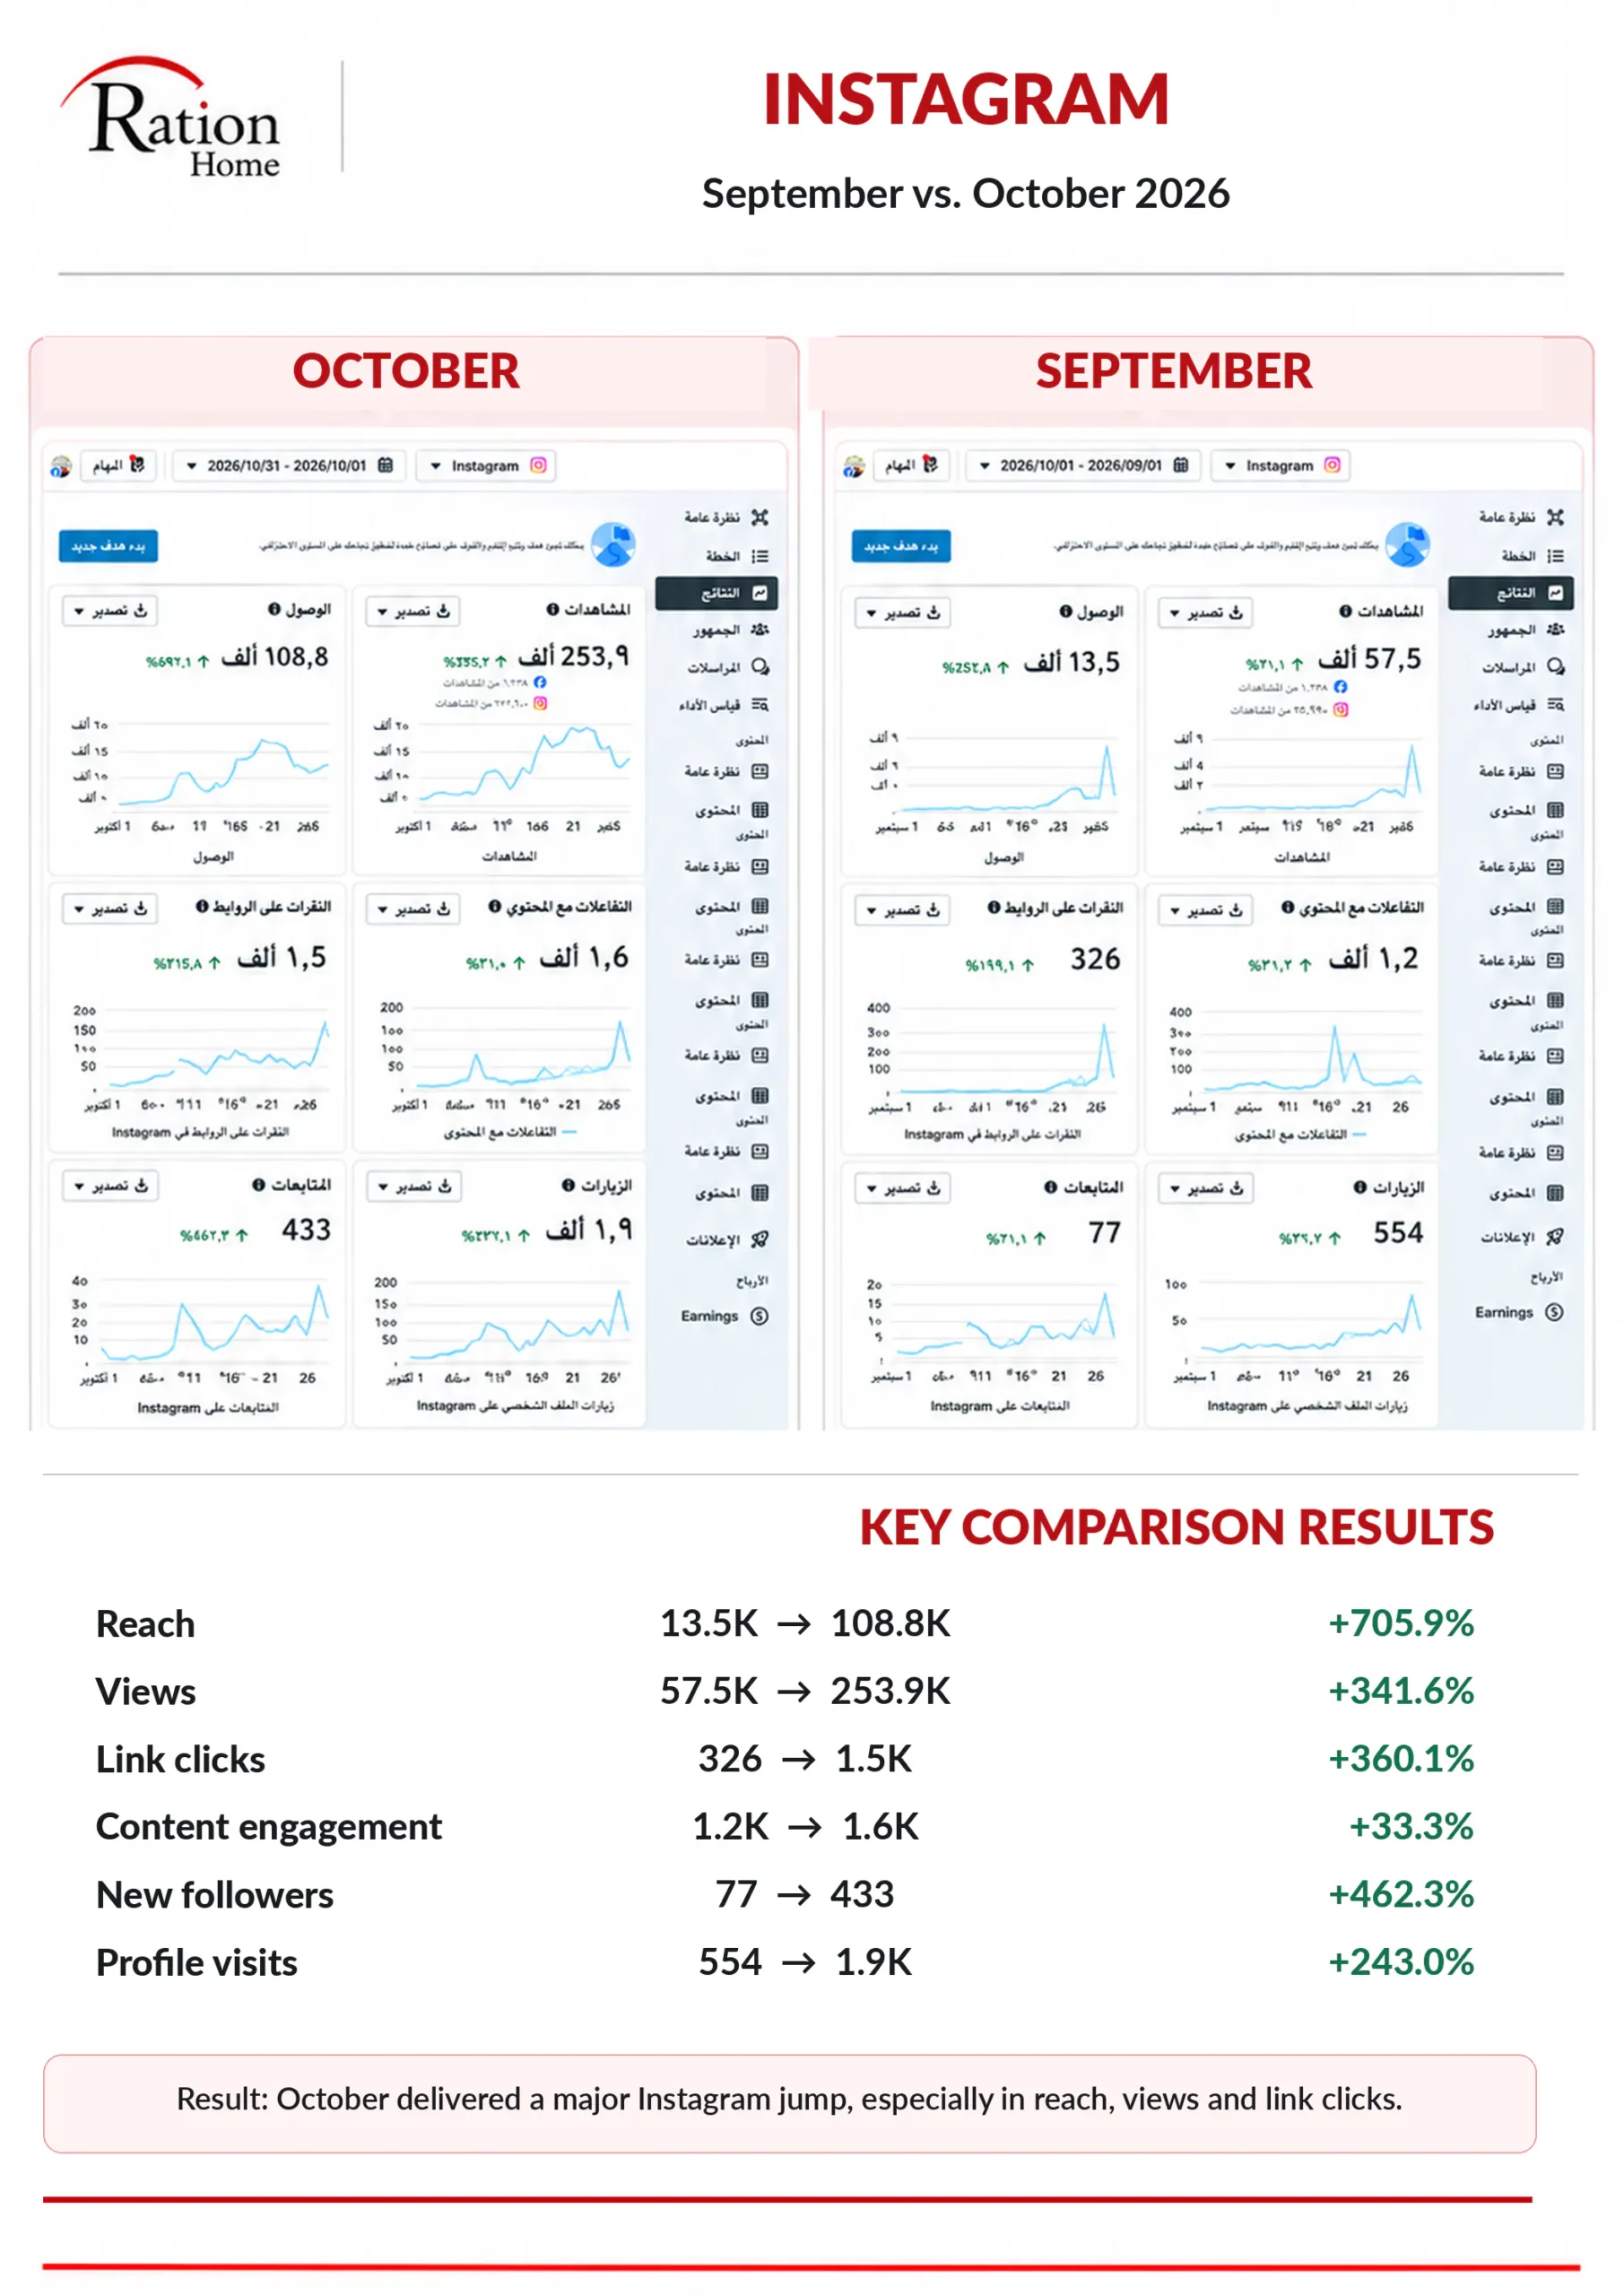
Instagram evidence: the report compares September and October side by side and shows simultaneous growth in reach, views, link clicks, follows and profile visits. That matters because the improvement was not limited to one vanity metric; discovery and user actions moved together.
Instagram produced the clearest month-over-month expansion in the report:
- Reach: 13.5K → 108.8K (+705.9%)
- Views: 57.5K → 253.9K (+341.6%)
- Link clicks: 326 → 1.5K (+360.1%)
- Content interactions: 1.2K → 1.6K (+33.3%)
- Follows: 77 → 433 (+462.3%)
- Profile visits: 554 → 1.9K (+243.0%)
The most useful part of this result is not only the reach increase. Link clicks, follows and profile visits also moved upward, which indicates that the growth was connected to stronger user actions rather than visibility alone.
TikTok: From 129 Views to 163.7K
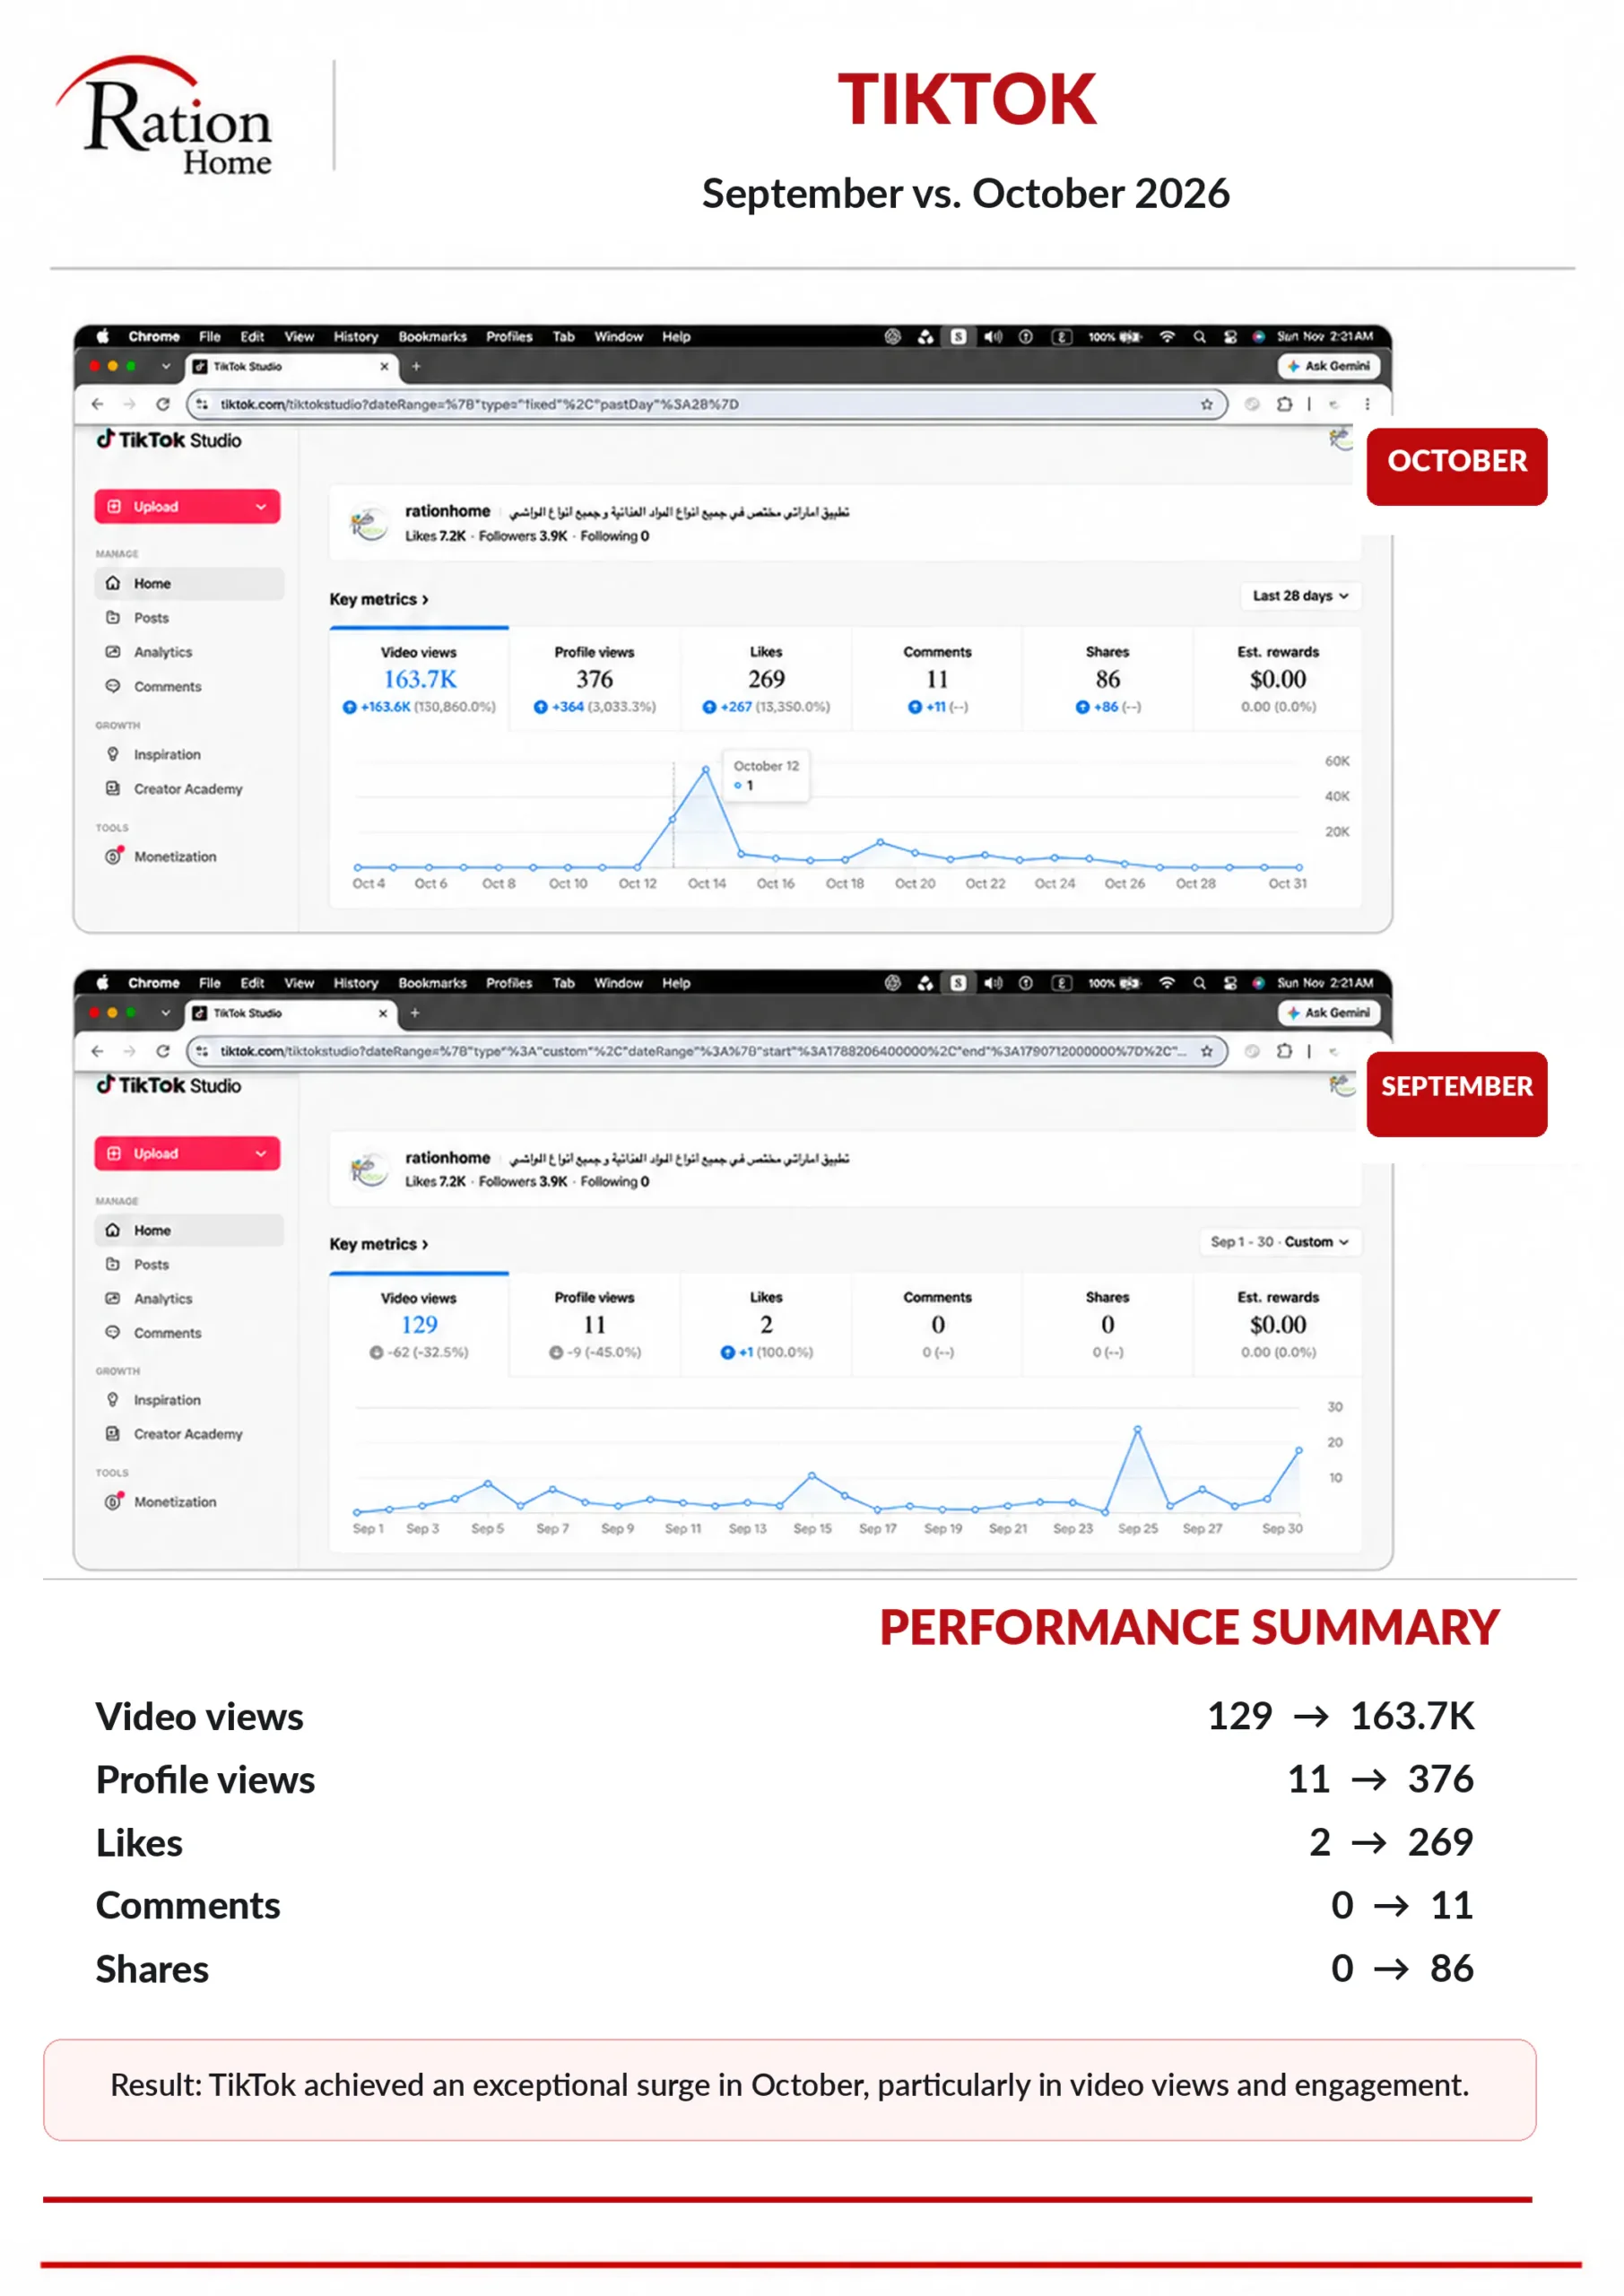
TikTok evidence: the supplied TikTok Studio screenshots show September at 129 video views and October at 163.7K, with additional increases in profile views, likes, comments and shares. This is the clearest platform-level visibility jump in the report.
TikTok showed the sharpest raw platform jump. The report compares September with October:
- Video views: 129 → 163.7K
- Profile views: 11 → 376
- Likes: 2 → 269
- Comments: 0 → 11
- Shares: 0 → 86
This type of movement is why I separate content reach from content response. A viral or high-reach post can create a spike, but profile visits, shares and engagement help show whether the audience moved beyond passive viewing.
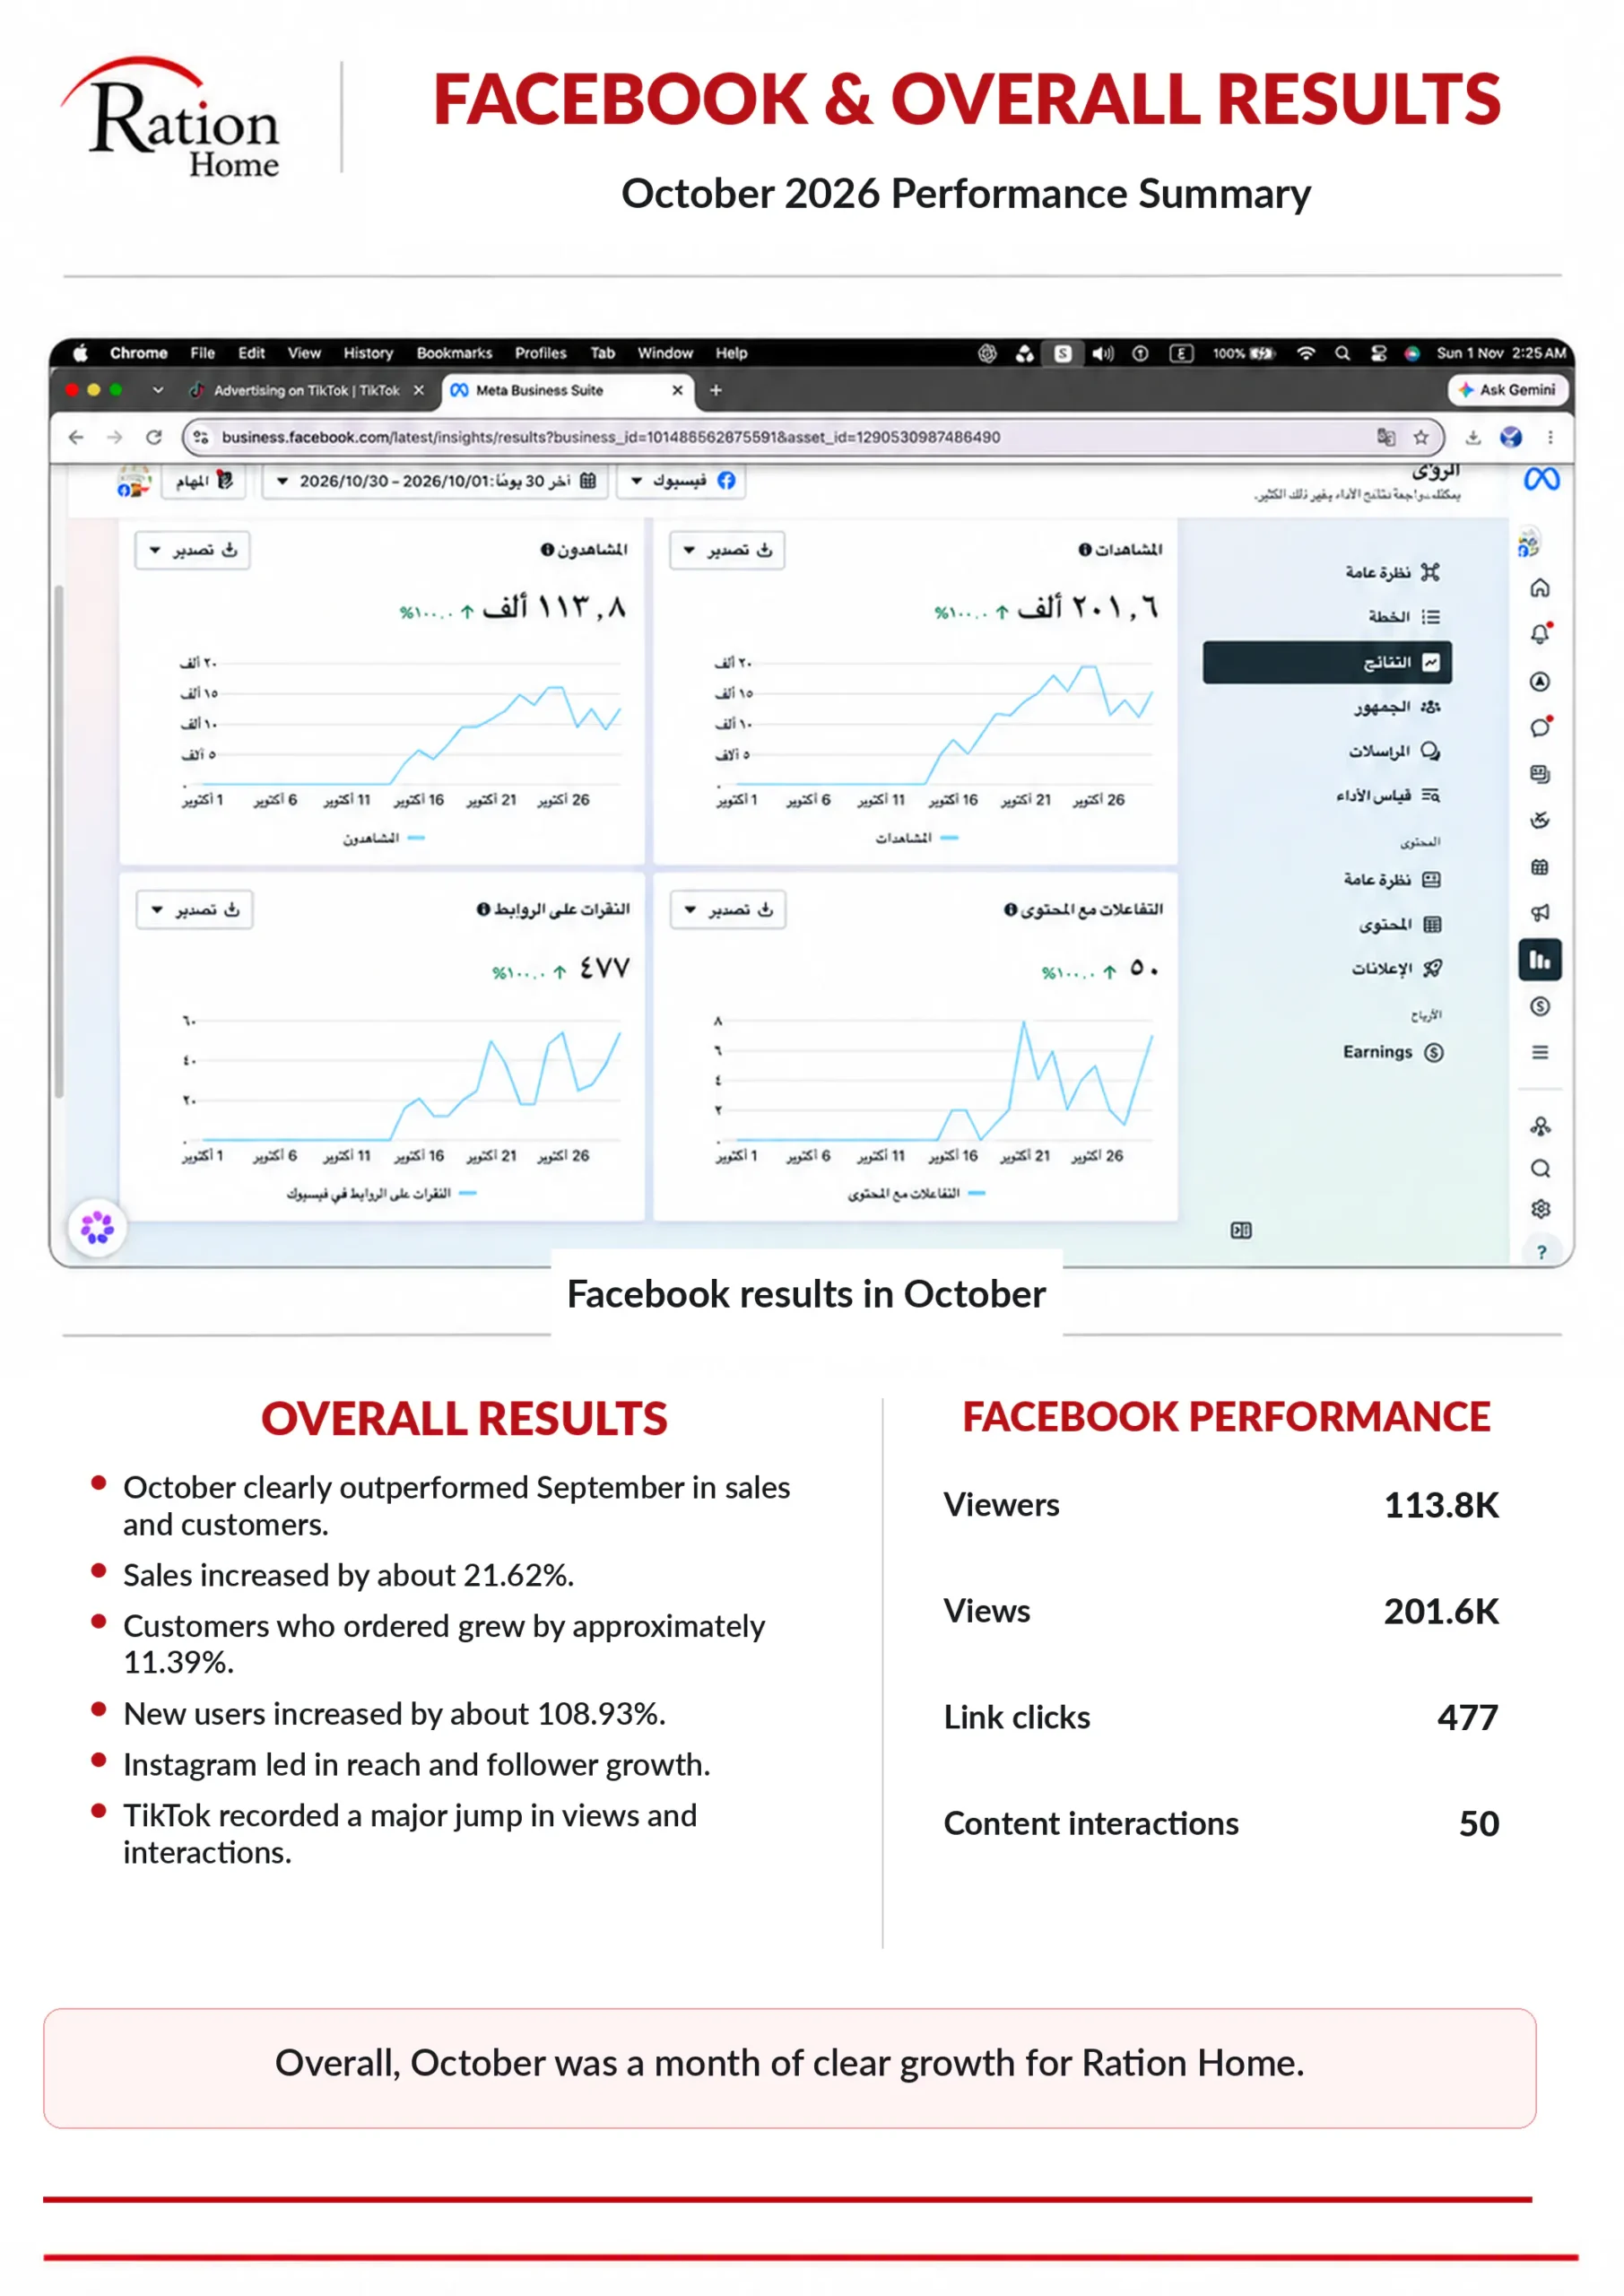
Facebook Performance in October
Facebook evidence: the October dashboard records 113.8K viewers, 201.6K views, 477 link clicks and 50 content interactions. The screenshot also sits beside the report’s overall business summary, helping connect platform activity with the wider month-over-month result.
The October Facebook report recorded:
- Viewers: 113.8K
- Views: 201.6K
- Link clicks: 477
- Content interactions: 50
Facebook therefore contributed additional reach and traffic during the same period, alongside Instagram, TikTok and paid advertising.
What This Case Study Actually Demonstrates
The strongest conclusion is not “more views.” It is that the first month under the new management period showed simultaneous movement across three layers:
- Audience growth: reach, views, followers and profile visits increased.
- Action metrics: link clicks and engagement increased.
- Commercial metrics: reported sales, ordering customers and new users increased.
The report itself does not isolate the exact contribution of each individual post, ad, audience or platform to total sales, so I do not treat the 21.62% sales increase as a direct attribution claim. A stronger measurement setup would connect campaign source, customer journey and purchase data at a more granular level.
How I Approach Social Media Management and Paid Ads
As a marketing specialist in Dubai, I treat social media marketing in Dubai and social media advertising in Dubai as one acquisition system rather than two disconnected tasks. Organic content creates attention and trust; paid media accelerates distribution and conversion opportunities; analytics show which activity deserves more budget or creative effort.
For businesses in Dubai and the UAE, that means monitoring more than follower growth. I look at reach, qualified traffic, cost, conversion actions and the business metrics available after the click.
Related Marketing Case Studies
- Real Estate Meta Ads: 196 Leads at AED 25.52 CPL
- Real Estate CRM Funnel: 124 Leads, 10 Meetings & AED 25M Pipeline
- Construction Meta Ads: 93 Messaging Conversations
- Fashion Meta Ads: 88 WhatsApp Conversations
Need Social Media Management and Paid Ads in Dubai?
If you want social media content, paid advertising and reporting managed around measurable business outcomes, see my digital marketing services in Dubai, performance marketing approach, or contact me to discuss your account.
Source: client reporting for September and October 2026. Results relate to this specific account and reporting period and are not a guarantee of future performance.

Ali Alkhatib
Informatics Engineer and digital professional working across web development, SEO, Flutter applications and digital growth in Dubai, UAE.