
This fashion social media marketing Dubai case study documents the baseline I inherited before taking over Velvet Bride’s social media management in November 2026. The account already had meaningful visibility on Instagram and TikTok between August 1 and October 31, 2026. The challenge was not simply to generate more views. It was to identify which content signals real interest, improve the path from discovery to booking, and build a measurable 30-day content system around the strongest evidence.
Velvet Bride is a bridal and evening-dress business in Sharjah, UAE. The brand operates in a visual category where reach can grow quickly, but high view counts do not automatically translate into qualified enquiries, fitting appointments or sales. This case study separates those two ideas: attention and commercial intent.
It also connects to two other documented parts of the same fashion marketing cluster: my fashion Meta Ads case study and my fashion SEO case study.
Executive Summary: The Account Already Had Reach — The Opportunity Was Conversion
The August-to-October baseline showed strong organic distribution across both platforms. Instagram recorded approximately 1.47 million Instagram views within the reporting period, alongside 354.6K viewers, 60.9K profile visits, 55.3K content interactions, 5.8K follows and 1.1K link clicks. TikTok Studio recorded approximately 2 million video views, 41.8K profile views, 21.2K likes, 5.7K shares and 214 comments.
Those numbers prove that the brand could attract attention. They do not prove how many appointments, fittings or purchases came from that attention. That distinction became the basis of the November strategy.
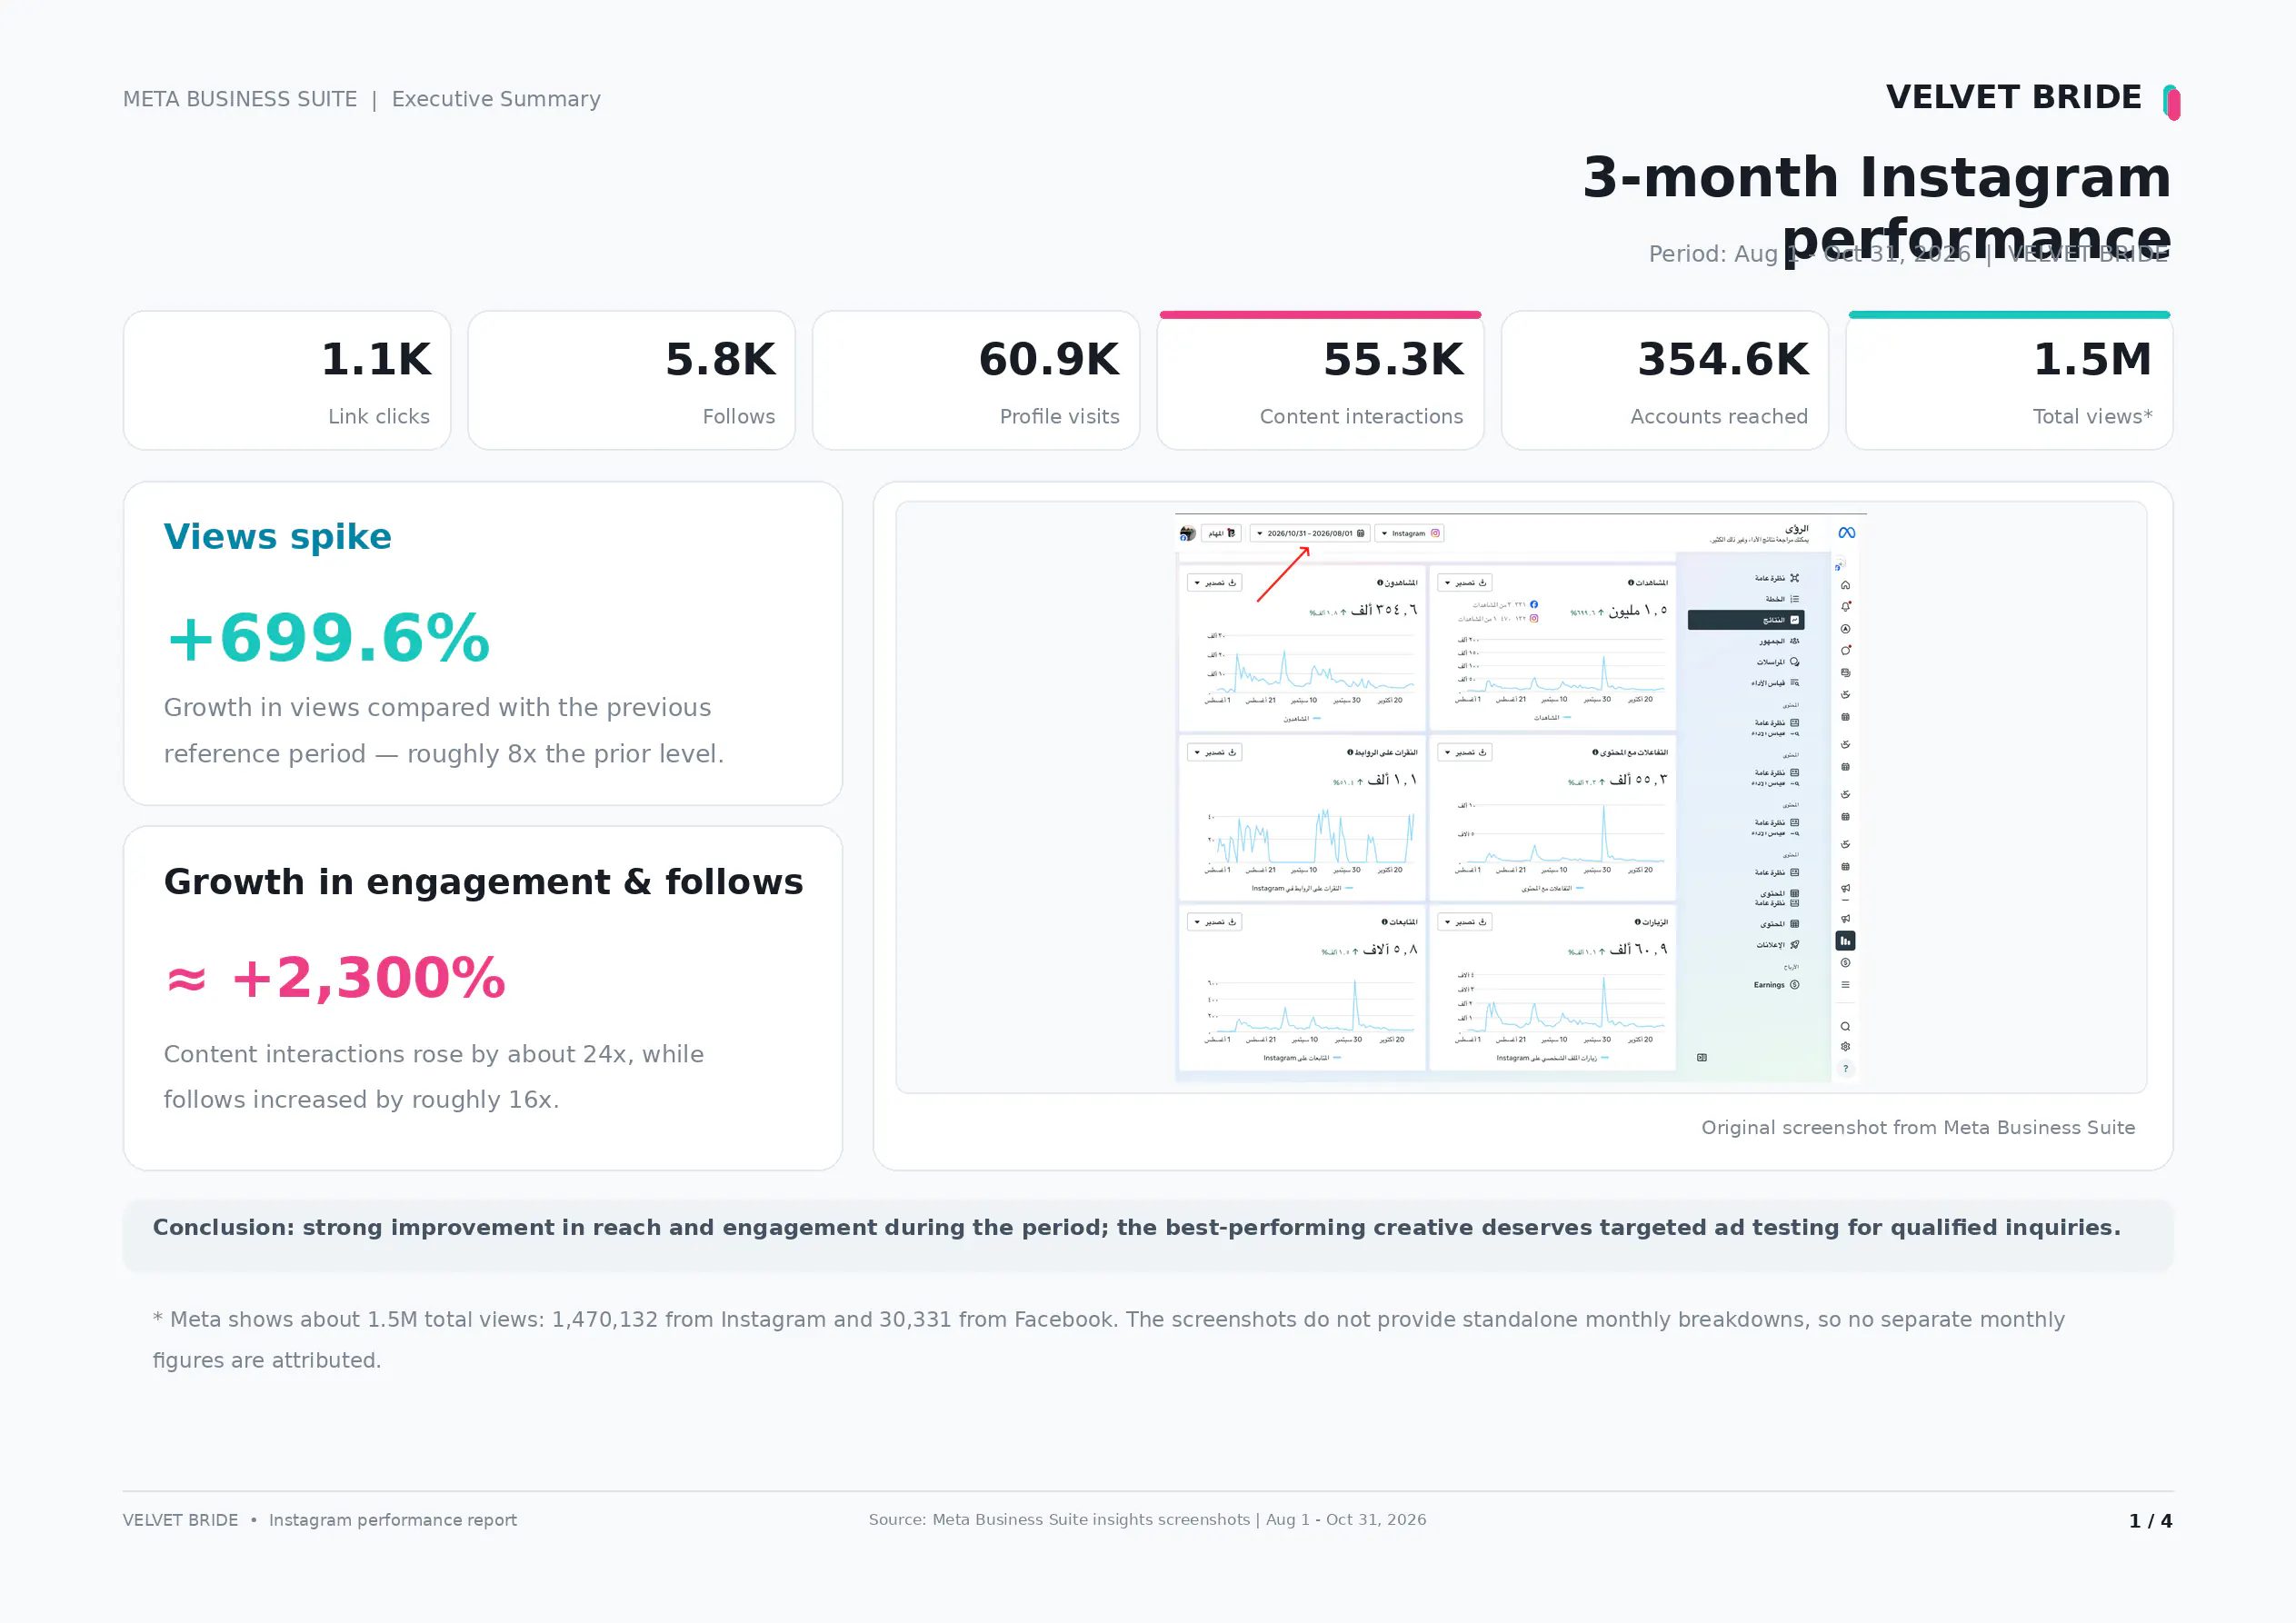
The Three-Month Instagram Baseline Before Takeover
The Instagram report covered August 1 through October 31, 2026. The strongest change shown in the source report was a sharp expansion in viewing activity compared with the preceding reference period. The report recorded a +699.6% increase in views and an approximate +2,300% increase in engagement and follows versus that reference period.
More important than the aggregate growth was the difference between individual posts. One collaborative showroom reel generated 165.5K views, 8.3K interactions and 165 follows. Another reel featuring dress details recorded only 19K views, but produced 124 follows from those 19K views with a 4.4% interaction rate.
This matters because the post with the largest reach was not automatically the only creative worth testing. A lower-view reel can still be commercially interesting when it creates a disproportionately strong follow, save, profile-visit or enquiry signal.
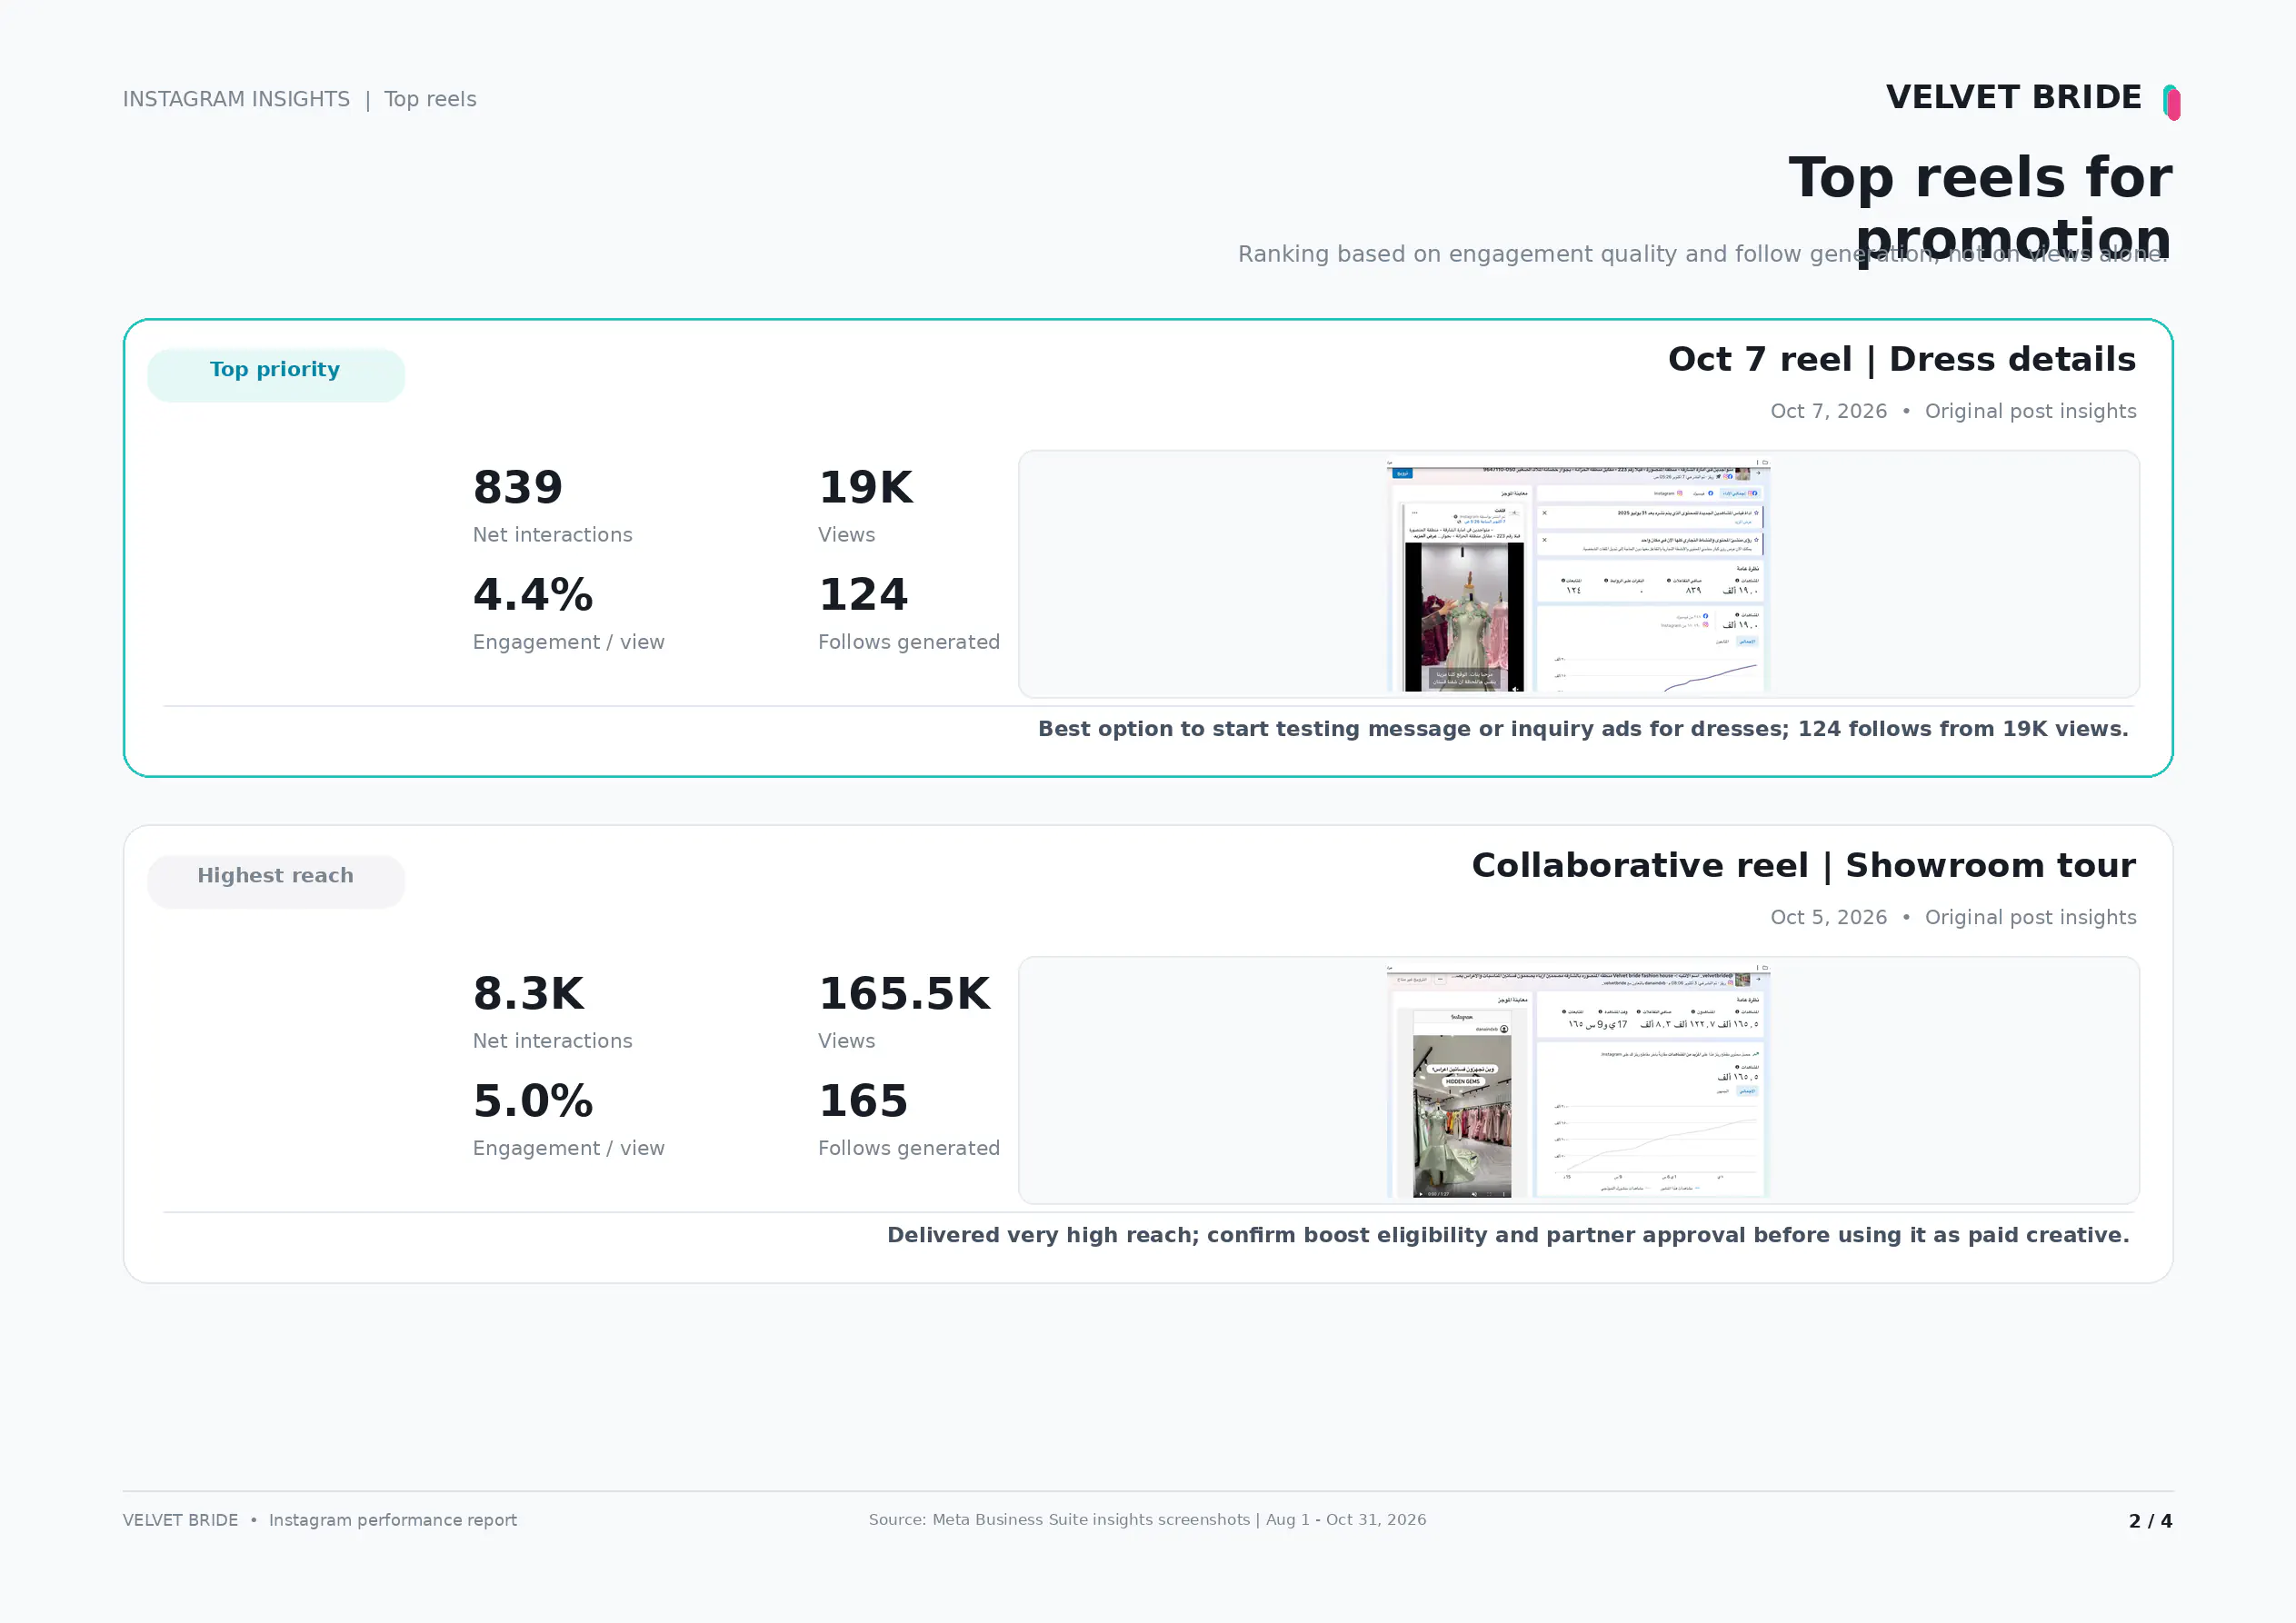
Why I Would Not Choose Instagram Creatives by Views Alone
The Instagram creative review produced four different patterns:
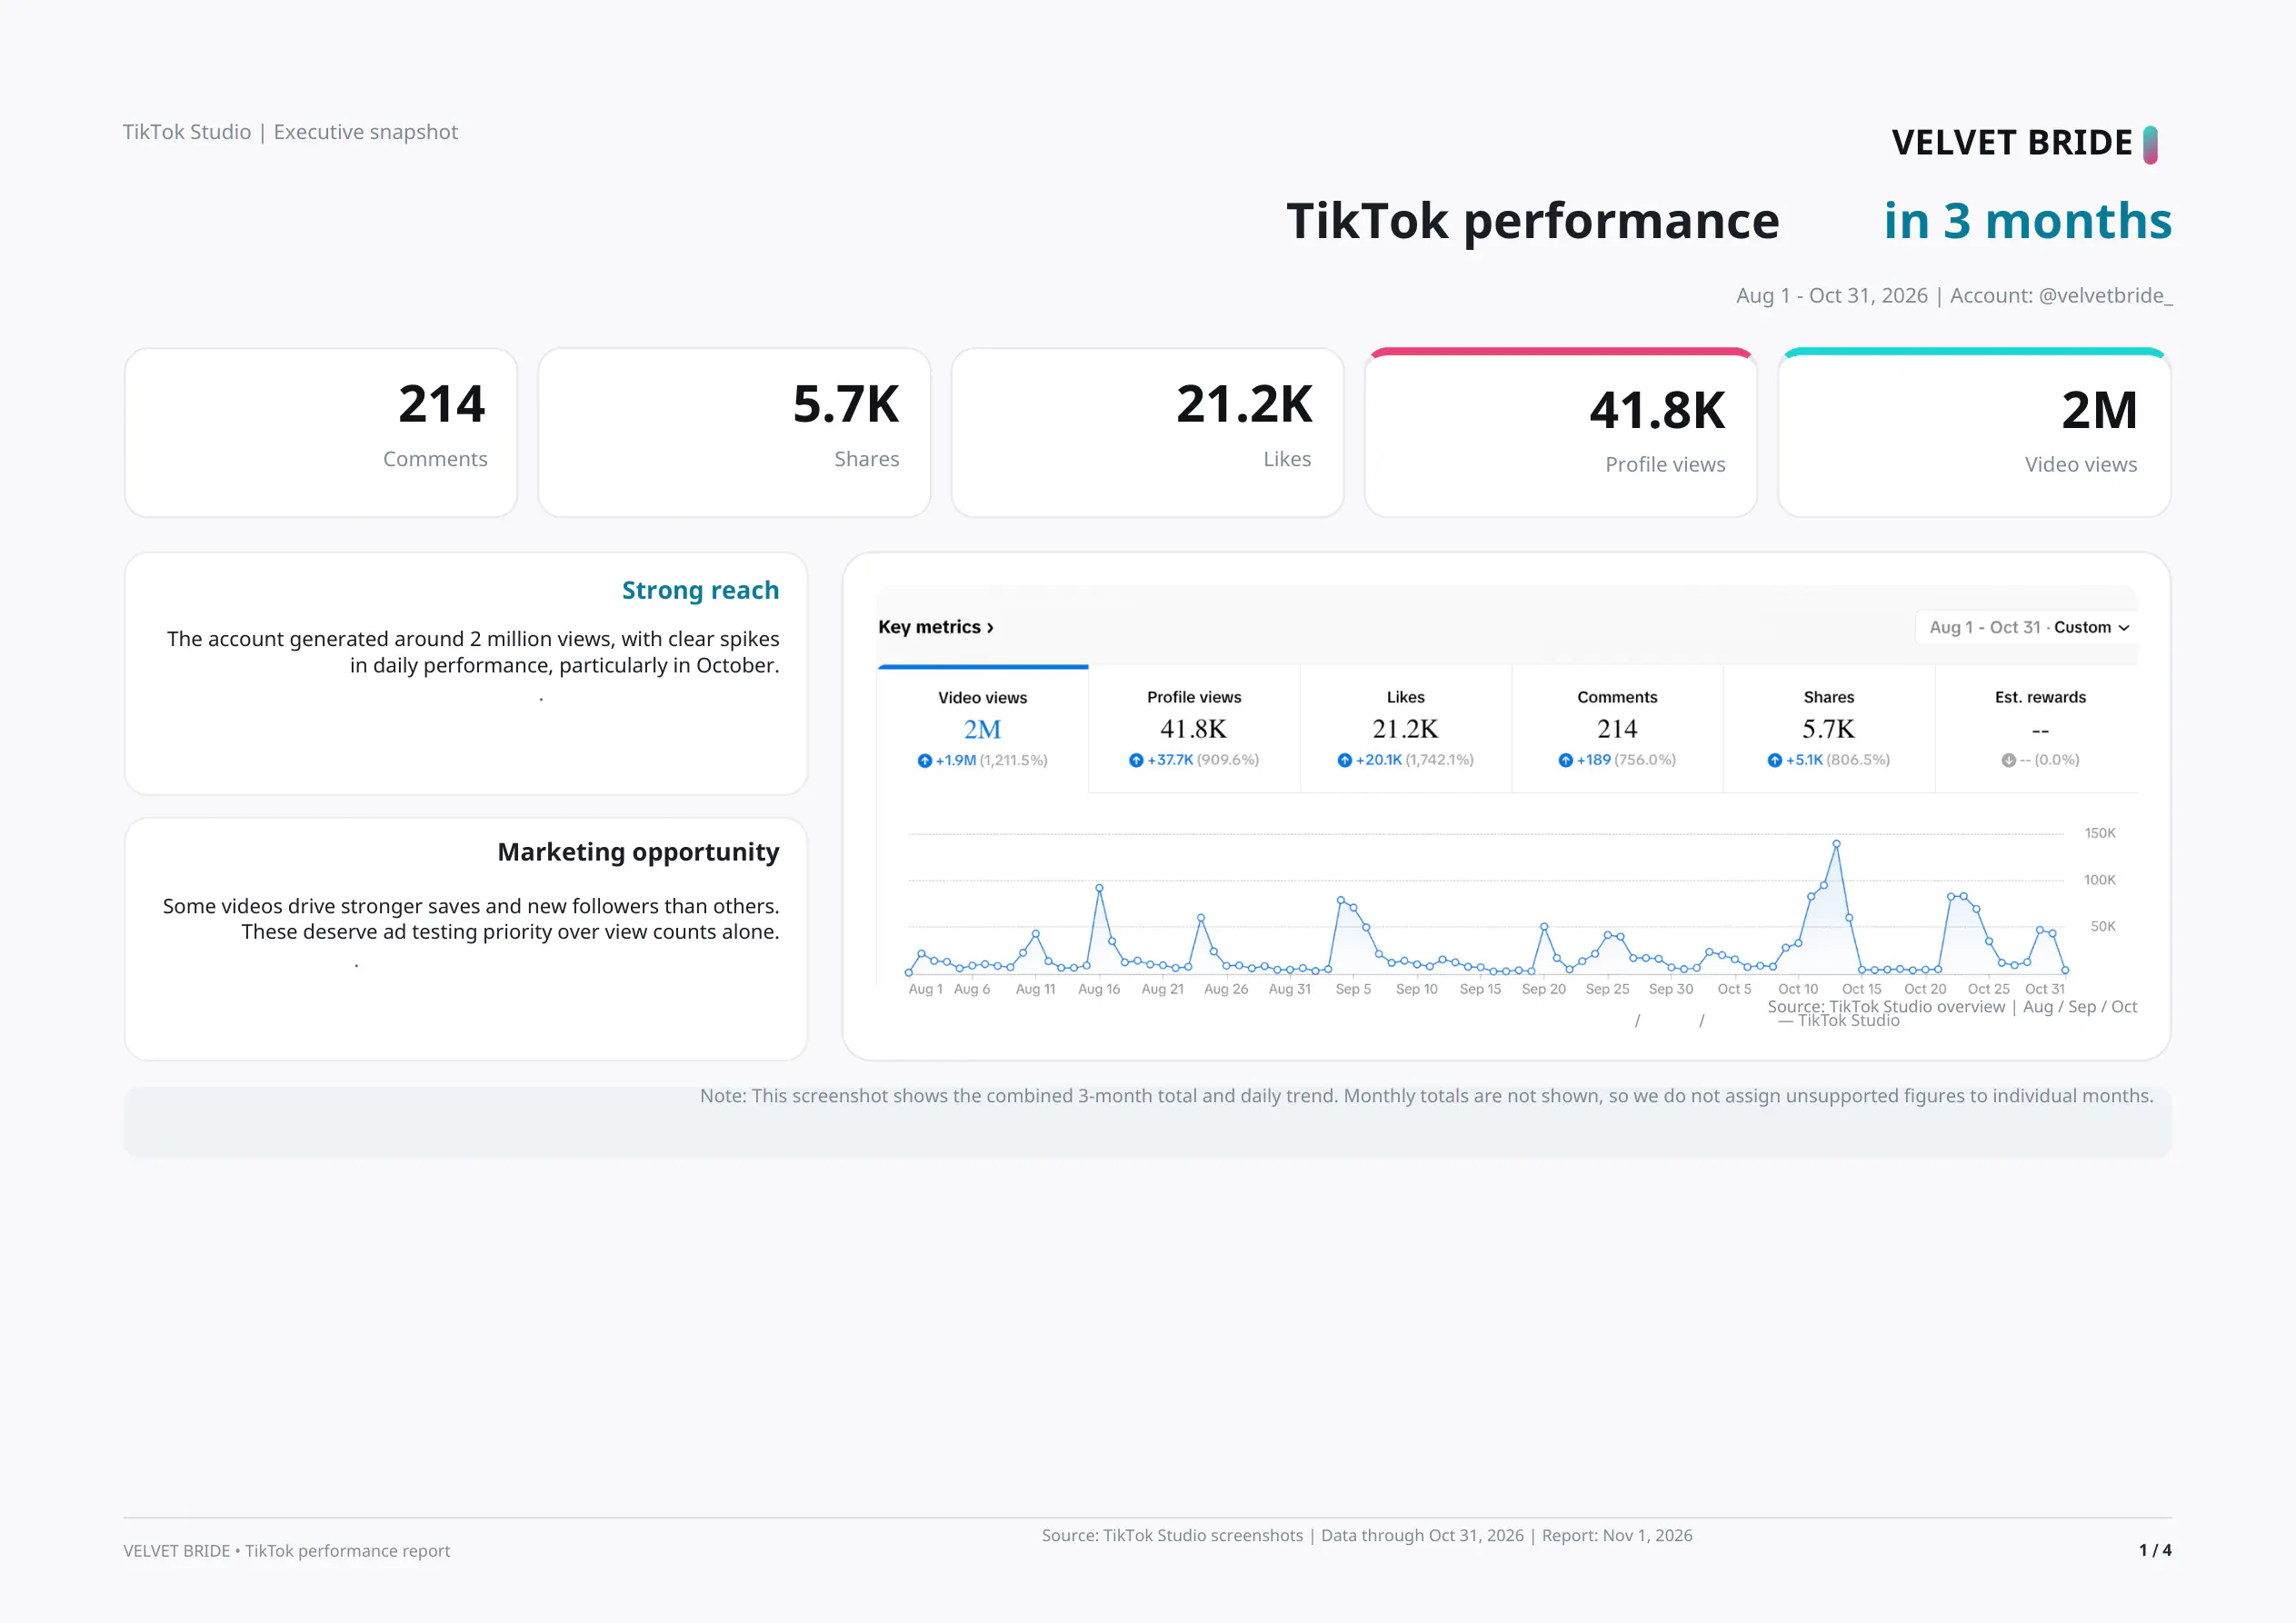
- High-intent dress-detail reel: 19K views, 839 interactions, 124 follows and a 4.4% interaction rate.
- High-reach collaborative showroom reel: 165.5K views, 8.3K interactions, 165 follows and a 5.0% interaction rate.
- Carousel suitable for retargeting: 11.3K views, 228 interactions and 24 follows.
- Lower-performing October reel: 7.6K views, 84 interactions and 15 follows.
The practical conclusion was to give each creative a different job. The 19K-view reel was a strong candidate for enquiry-oriented testing because its follow response was strong relative to reach. The collaborative reel was useful for broader reach if reuse and promotion rights were confirmed. The carousel was better positioned as supporting or retargeting content. The weakest reel needed creative improvement before paid promotion.
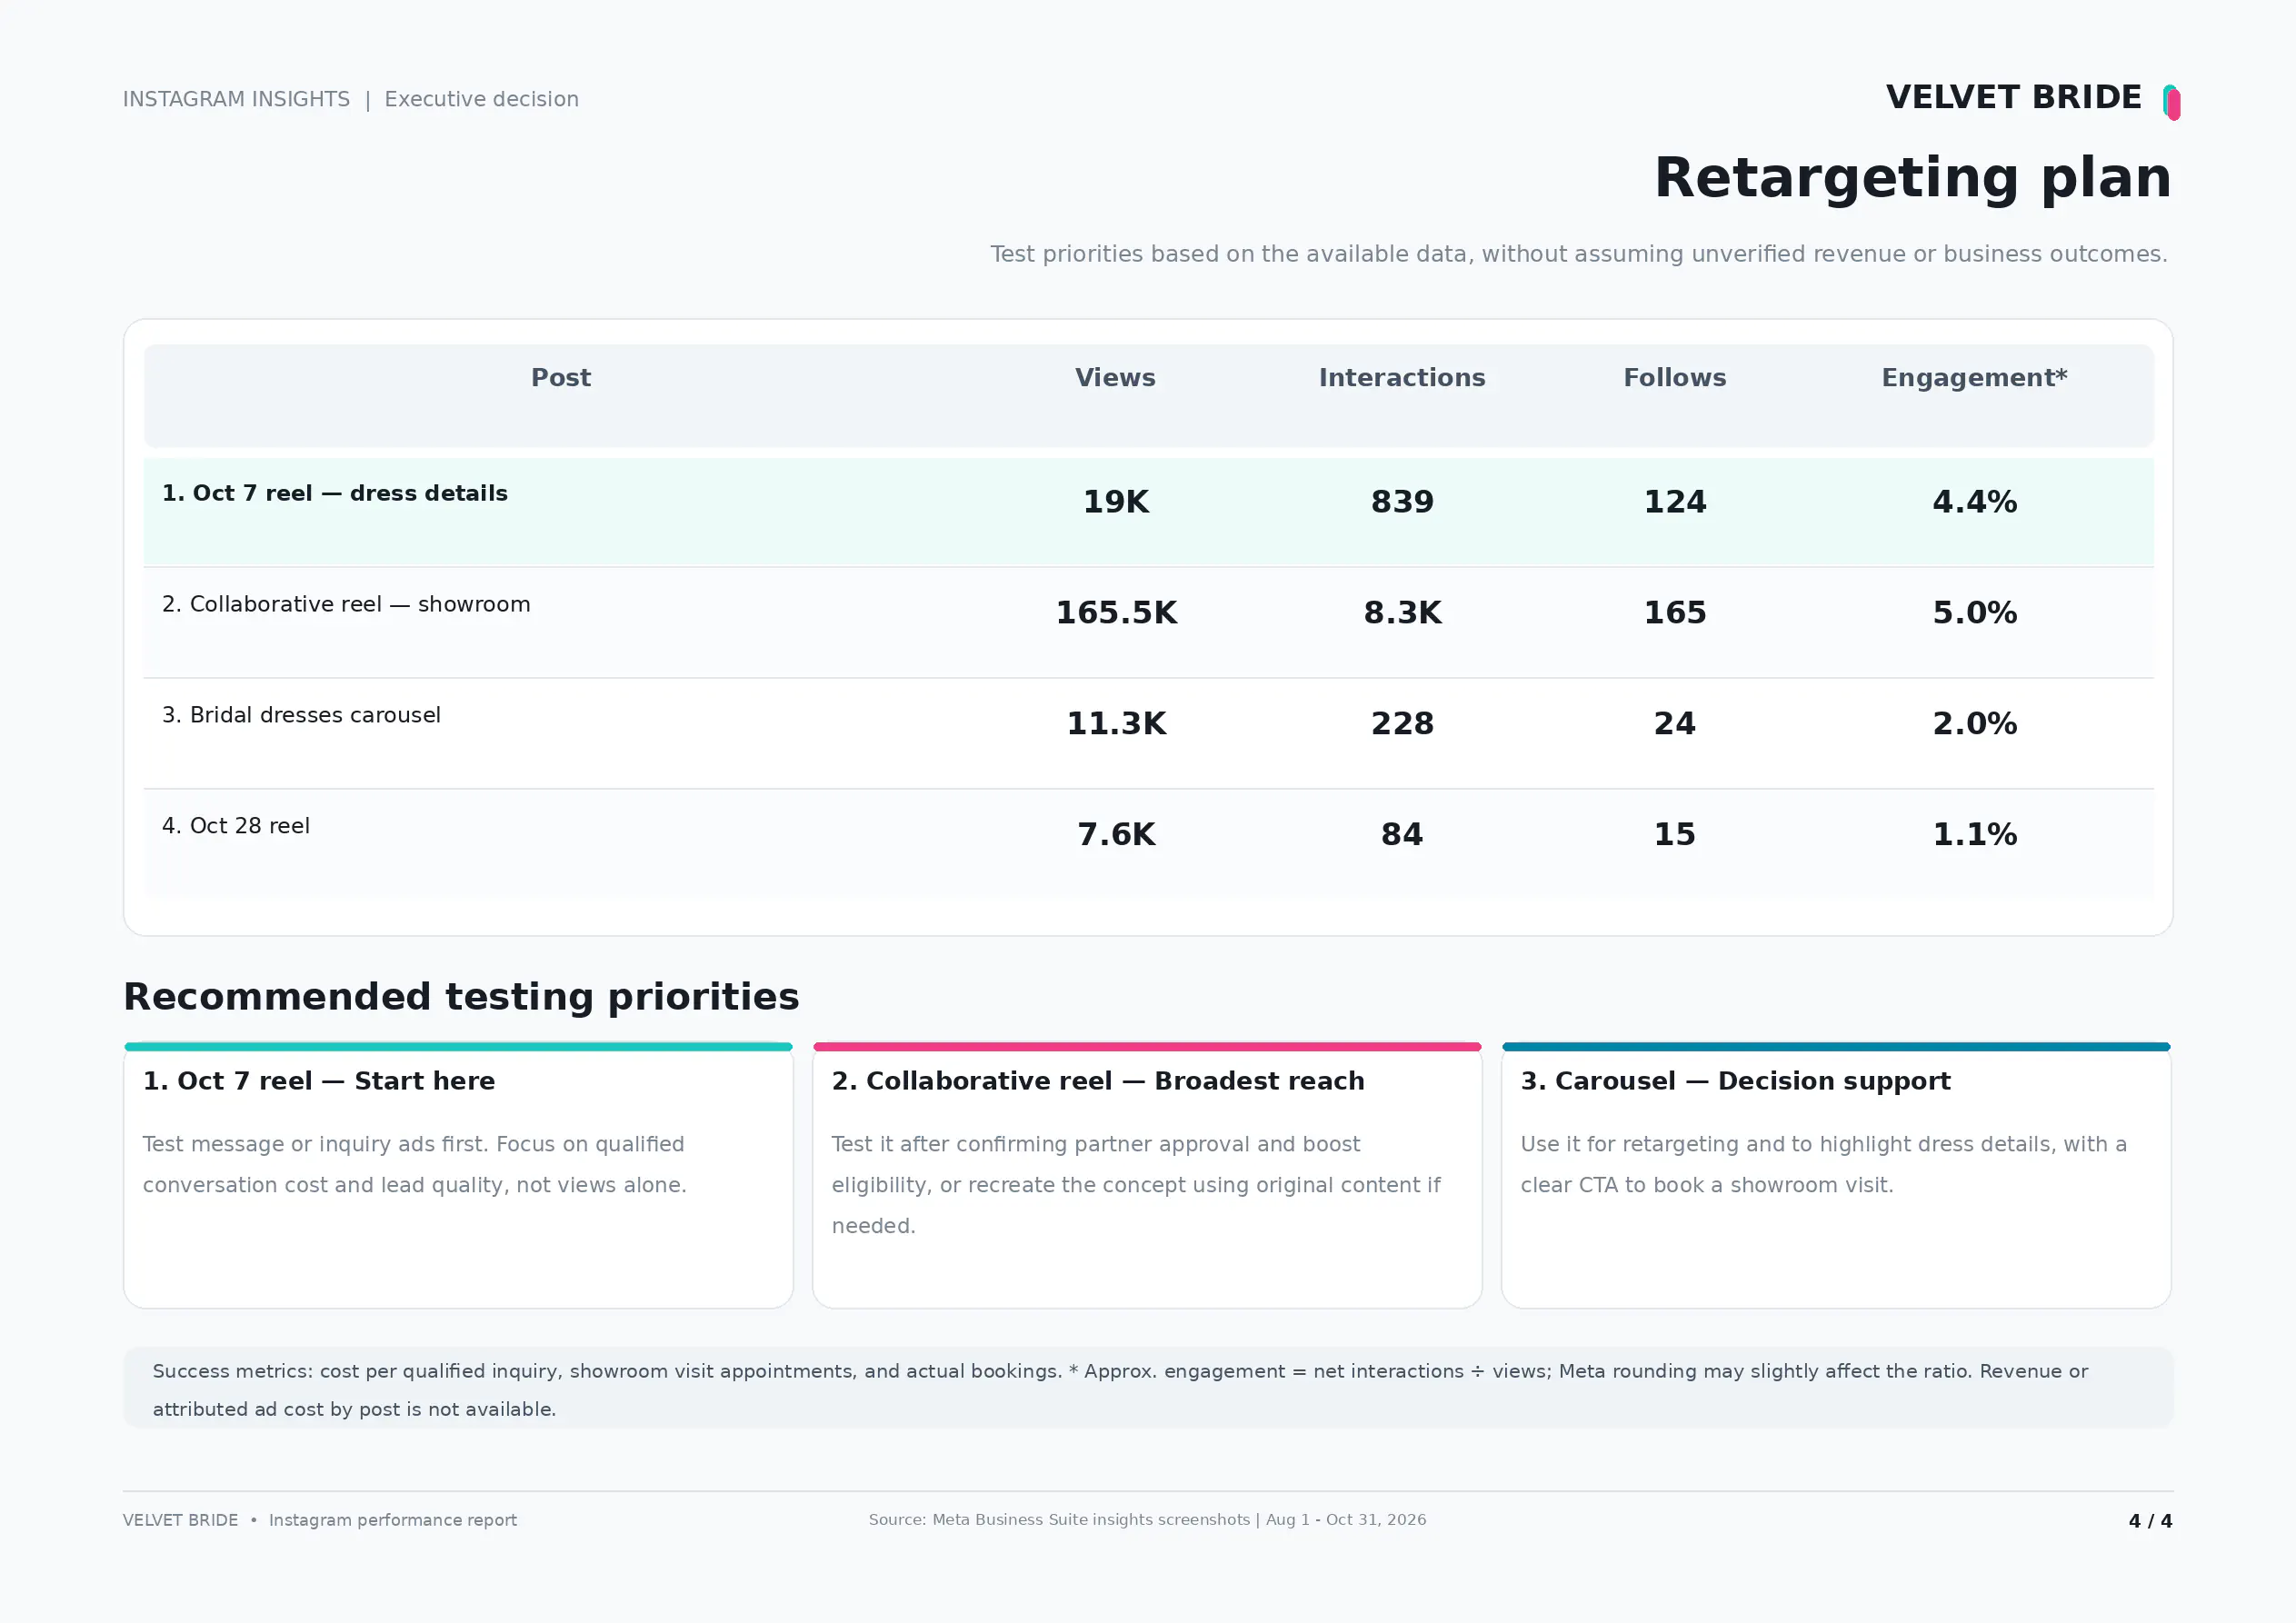
The TikTok Baseline: 2 Million Views Across Three Months
TikTok showed a similar pattern at a larger short-form-video scale. Between August 1 and October 31, TikTok Studio recorded approximately 2 million video views, 41.8K profile views, 21.2K likes, 5.7K shares and 214 comments.
The account clearly had the ability to break beyond its follower base. But the strongest marketing lesson came from comparing individual videos rather than celebrating the 2M headline.
The Best TikTok Video Was Not the One With the Most Views
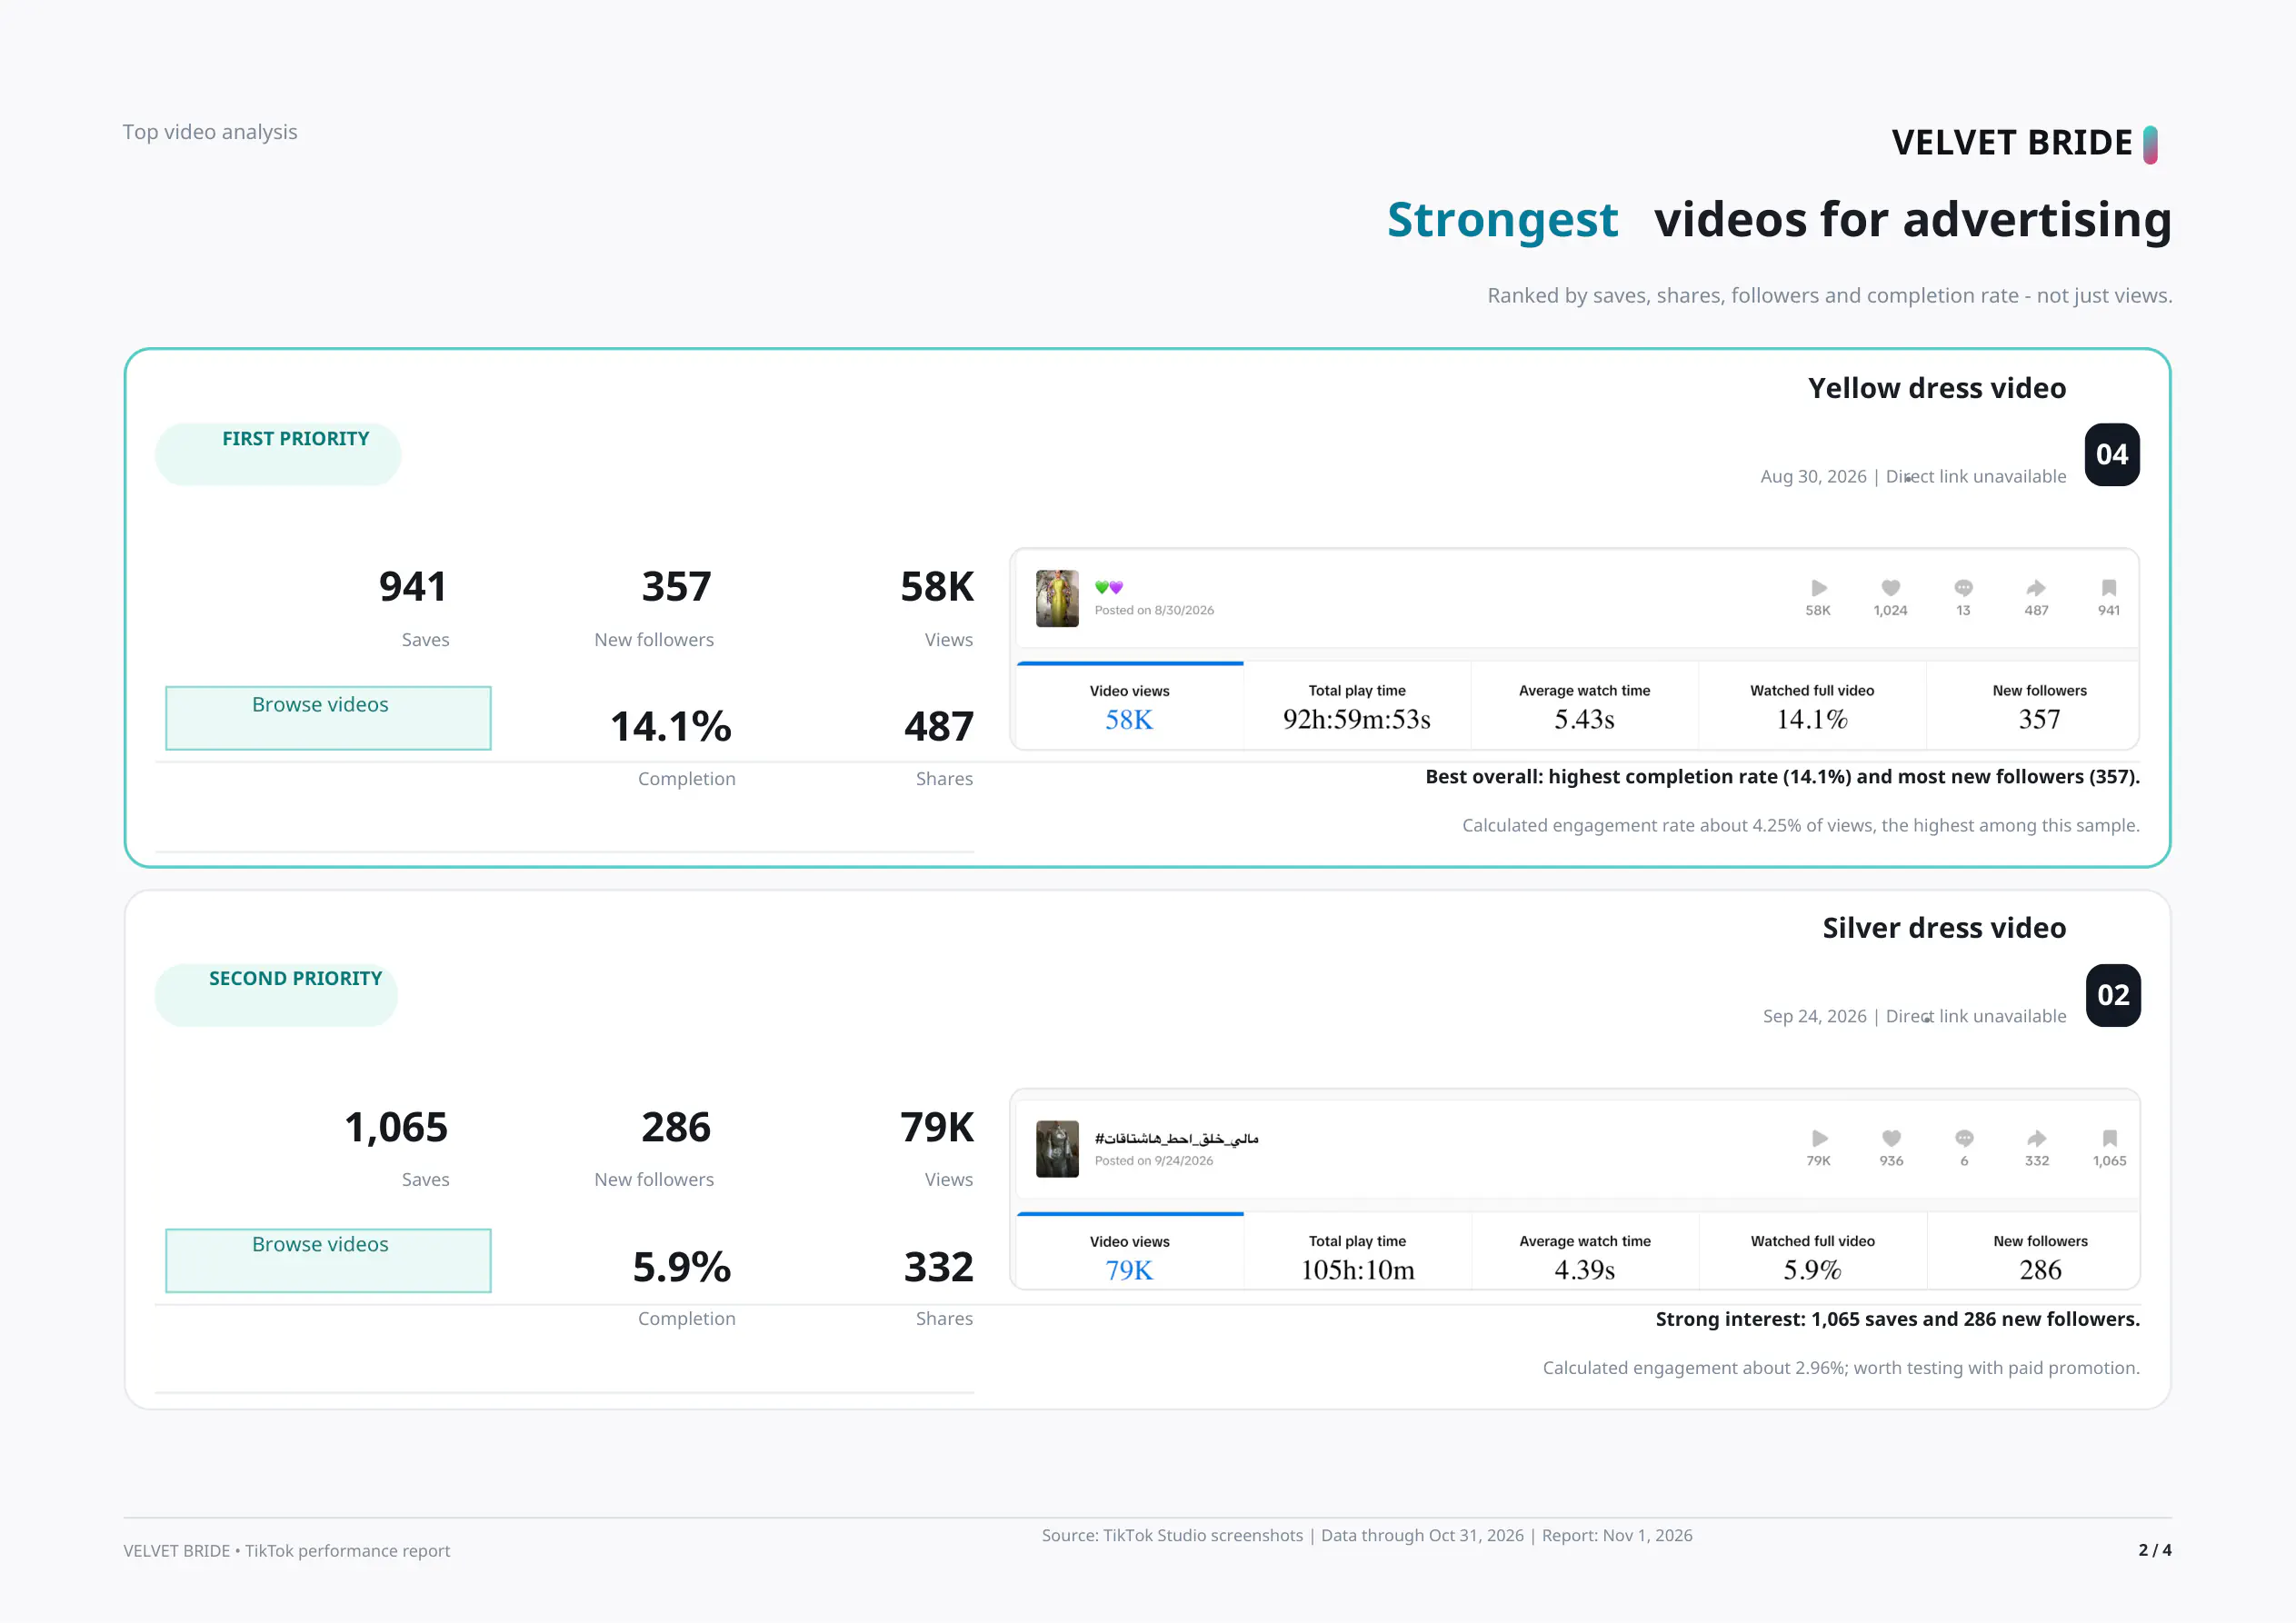
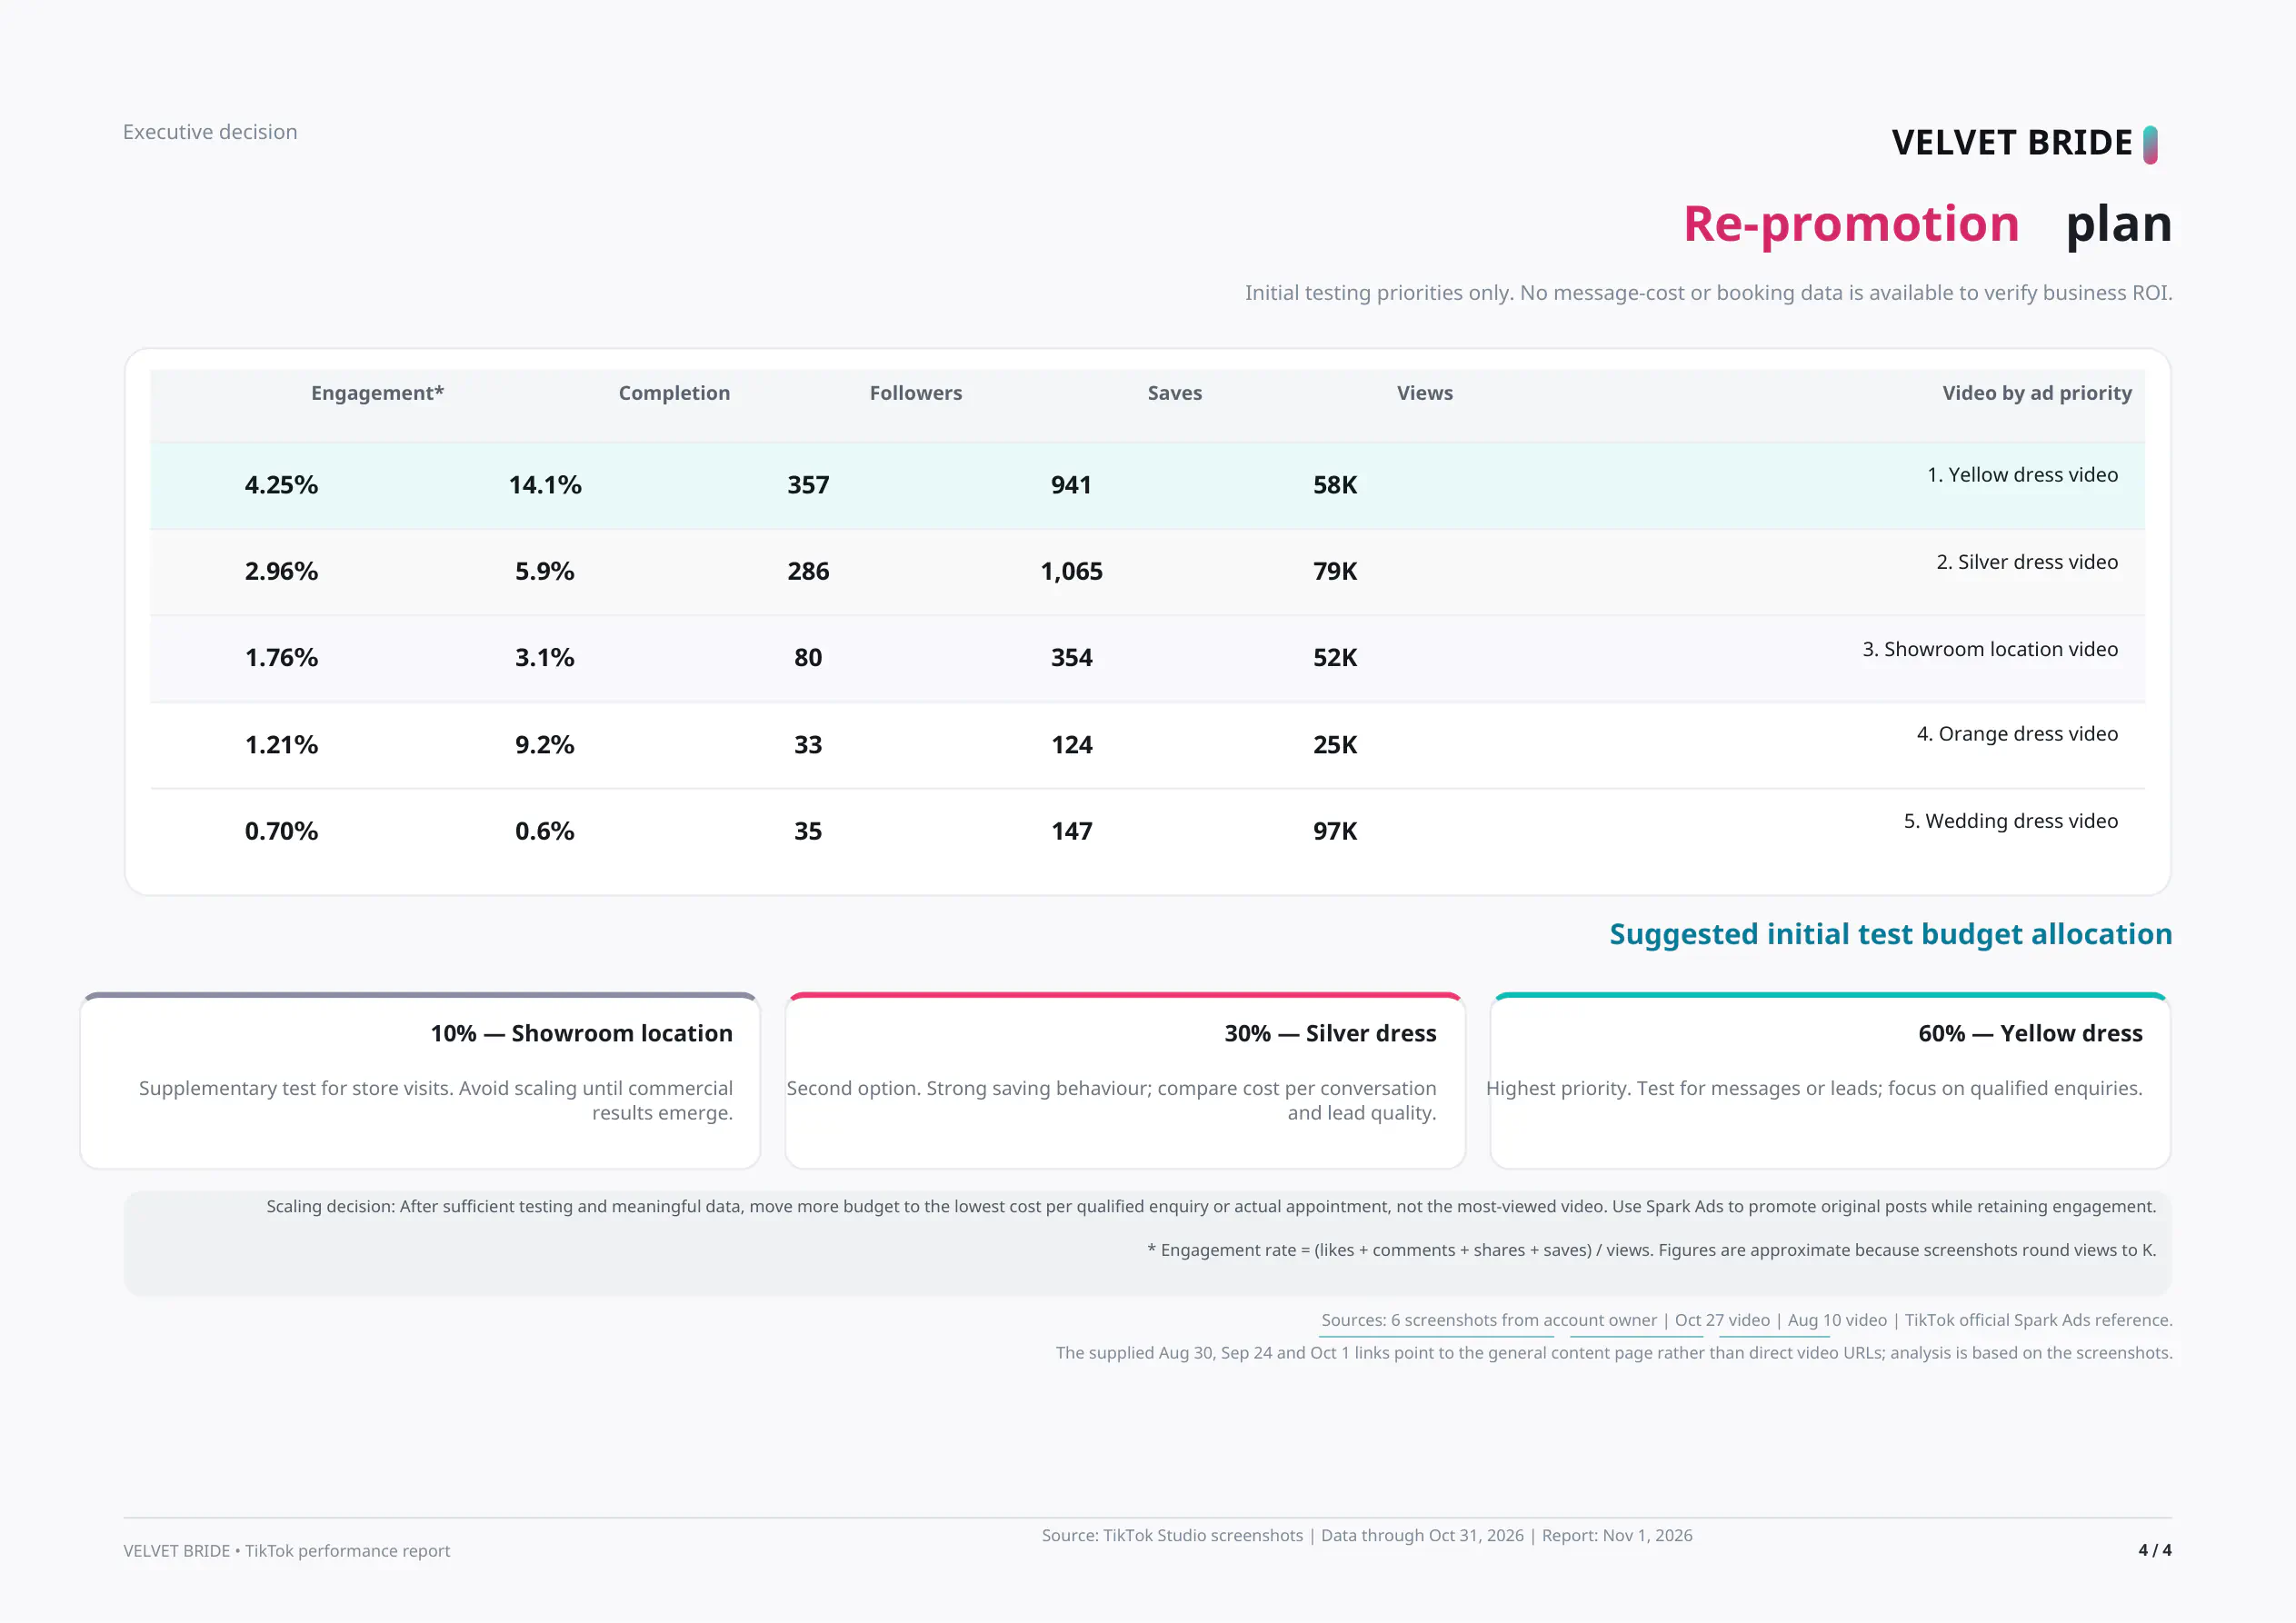
The strongest TikTok candidate in the reviewed sample was the yellow-dress video. It generated 58K views, 941 saves, 487 shares, 357 new followers and a 14.1% full-video completion rate. The calculated content interaction rate in the report was approximately 4.25%.
The silver-dress video was another strong candidate, with 79K views, 1,065 saves, 332 shares, 286 new followers and a 5.9% completion rate.
Those results are strategically more useful than simply selecting the highest-view video. Saves, shares, follower generation and completion can reveal deeper interest in the content and give us better signals for future creative testing.
A 97K-View Video Was a Weak Advertising Candidate
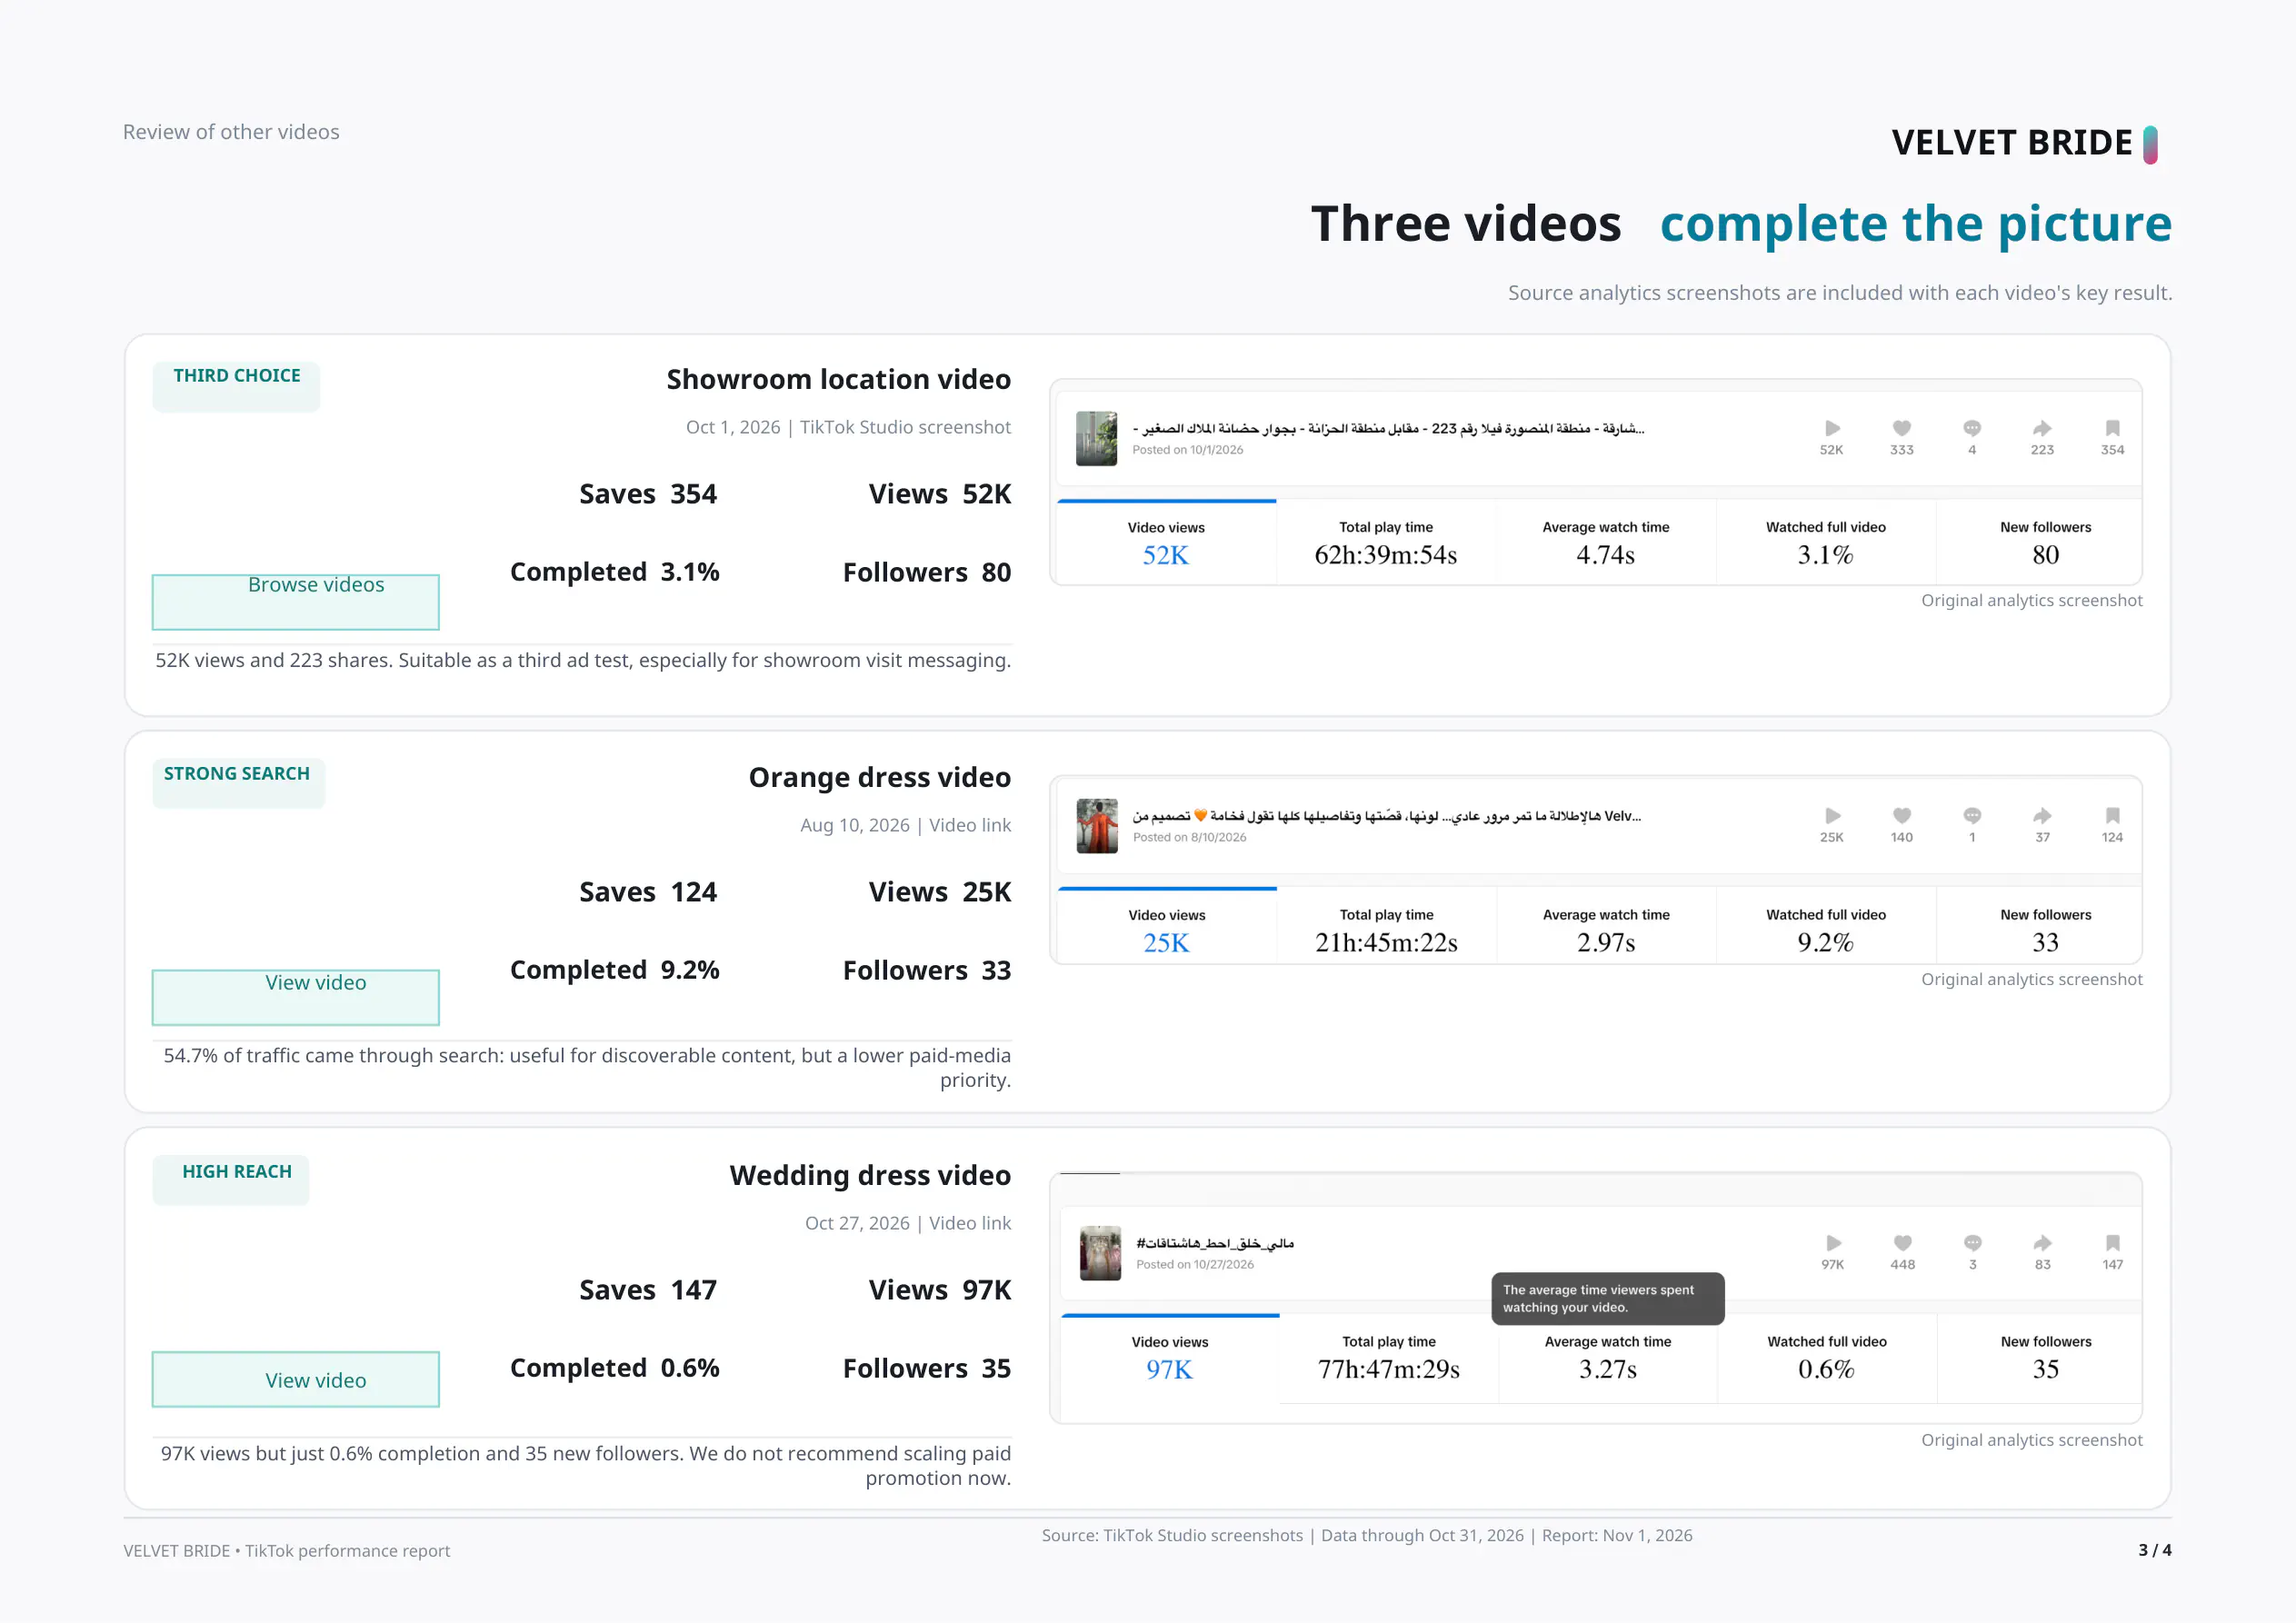
A bridal-dress video reached 97K views, but generated only 35 new followers, 147 saves and a 0.6% completion rate. The view count was attractive, but the deeper signals were much weaker.
Another orange-dress video reached only 25K views, yet achieved a 9.2% completion rate. The report also showed that approximately 54.7% of its traffic came from search, making it interesting from a TikTok discovery and search-behaviour perspective even though its total reach was lower.
This is one of the most important lessons in the entire case study: viral-looking reach is not enough to decide what deserves media budget.
Want the Strategy Behind These Results?
The performance analysis above explains what the August–October baseline revealed. I separated the planning and execution framework into a dedicated guide so the two search intents do not compete with each other.
Read the full Fashion Social Media Strategy Dubai guide for the November audit, Instagram and TikTok content pillars, 30-day publishing system, implementation sequence and booking-focused measurement framework.
How Organic Content Supports Paid Fashion Advertising
This organic analysis also improves paid-media decisions. Instead of choosing ad creatives based only on aesthetic preference, we can use organic signals to identify content that earns saves, shares, follows, profile visits and completion.
That process complements the existing Velvet Bride Meta Ads case study, where a campaign generated 88 WhatsApp messaging conversations at AED 16.82 per conversation. Paid media and organic content answer different questions, but the strongest system allows each side to inform the other.
What This Case Study Proves — and What It Does Not
The source reports support:
- The August-to-October Instagram and TikTok baseline metrics shown above.
- The performance differences between the reviewed organic creatives.
- The November 1 profile/content audits and their recommended content systems.
- A measurement plan focused on qualified enquiries and bookings rather than views alone.
This case study does not yet claim:
- That the August-to-October baseline was generated under my management.
- That the November strategy has already produced a specific percentage of growth.
- That organic social activity alone caused a specific number of sales.
- That a high-view video will automatically become the best paid advertisement.
This page can be updated with November results after the new strategy has enough data, turning the current baseline-and-strategy study into a documented before-and-after case study.
Fashion Social Media Marketing Lessons for Dubai & UAE Brands
- Do not confuse reach with intent. A smaller video can generate stronger saves, follows or completion.
- Use organic performance to inform creative testing. Paid campaigns should not select creatives by view count alone.
- Build a content system, not random posting. Expertise, product, craftsmanship, trust and booking content should work together.
- Make the booking path visible. Profile copy, pinned content, highlights and CTAs should explain the next step.
- Track qualified enquiries. Views are useful, but appointments and commercially relevant conversations are closer to the business goal.
Related Fashion Marketing Case Studies
- Fashion Social Media Strategy Dubai: 30-day Instagram & TikTok execution plan.
- Fashion Meta Ads Case Study: 88 WhatsApp conversations at AED 16.82.
- Fashion SEO Case Study: Velvet Bride organic search growth.
- Social Media Marketing Dubai Case Study: cross-platform September vs October growth.
Frequently Asked Questions
What should a fashion brand measure on Instagram and TikTok?
Views are useful for understanding distribution, but stronger analysis includes watch time, completion, saves, shares, profile visits, follows, qualified enquiries and bookings.
Can organic TikTok and Instagram data help choose ad creatives?
Yes. Organic data can provide useful signals about attention and intent, especially saves, shares, completion and follower generation. Paid testing is still required because organic and paid distribution behave differently.
Is the highest-view fashion video always the best one to promote?
No. In this case study, a 97K-view TikTok video had a 0.6% completion rate and generated only 35 new followers, while a 58K-view video generated 357 followers, 941 saves and a 14.1% completion rate.
How often should a fashion brand post?
The plan in this case was designed as a 30-day test, not a universal rule: Instagram at four feed posts per week and TikTok at approximately three original videos per week, with performance reviewed before deciding the next cadence.
About the Specialist Behind This Case Study
Ali Khair Aldeen Alkhatib is a UAE-based digital marketing, SEO and performance marketing specialist working across social media strategy, Meta Ads, Google Ads, lead generation, conversion tracking and digital growth.
Next Step
If your fashion or retail business has social media activity but needs a clearer path from content to enquiries, explore my digital marketing services in Dubai or contact me to discuss your project.

Ali Alkhatib
Informatics Engineer and digital professional working across web development, SEO, Flutter applications and digital growth in Dubai, UAE.